The Year in Assessment at TULUP: A Celebration

This week I submitted the Libraries’ annual report on assessment activities to the University’s Office of Assessment and Evaluation . It’s a requirement that I don’t particularly relish, as I often feel our approach to assessment at the Libraries is somewhat haphazard and often “just in time”. We’ve never had a formal assessment “plan”. 

But I was wrong to be discouraged. In fact, our assessment capacity has grown tremendously, with full time librarians in user experience (Jackie Sipes) and  collections analysis (Karen Kohn). As importantly, many, many staff from across the organization have contributed to assessment efforts this year. So celebration and appreciation are well deserved. 

Many staff were involved in the Envisioning Our Future project, conducted under the umbrella of ARL’s Assessment Framework. We interviewed staff to learn how they envisioned working in the new spaces at Charles, and conducted a second set of interviews after the move. Research team members in Phase I included Olivia Given Castello, Rachel Cox, Jessica Martin, Urooj Nizami, Jenny Pierce, Jackie Sipes, Caitlin Shanley, and Stephanie Roth.  In Phase II, Karen Kohn, Rebecca Lloyd, and Caitlin Shanley made up the research team. Over 40 staff members agreed to be interviewed, many participating in both phases.   The project has received wide recognition, most recently at the Library Assessment Conference as part of the session on Critical/Theoretical Assessment and Space.                

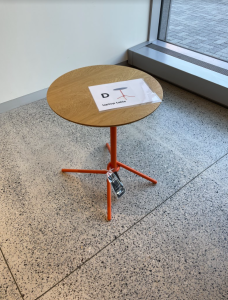
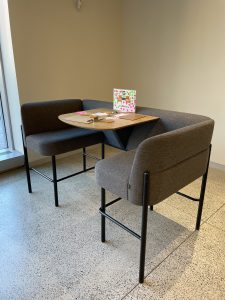
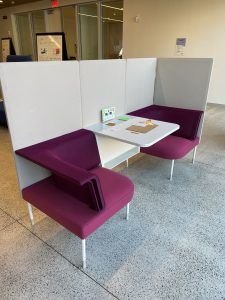
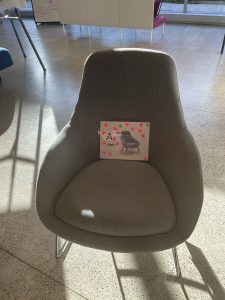
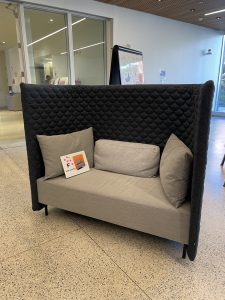
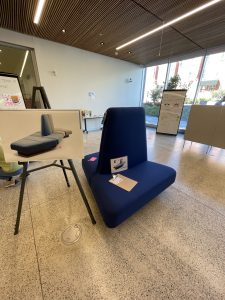
The Furniture Study was a multi-method approach, using a survey to students and daily observations to determine what types of furniture best supported the work they do at Charles Library. The project was led by Jackie Sipes and Rachel Cox and resulted in  several changes, including the positioning tables to improve privacy and quiet for student work.  This assessment was featured when the Middle States Accreditation Committee came to campus.  

Rachel Cox and Jackie Sipes also led a signage and wayfinding project, working with staff from Access, LDSS and LRS to  identify the top wayfinding issues in the building and determine content and placement of third floor directory signs. Many of our student workers in those departments, plus LTS students, also responded to surveys and provided feedback on the re-envisioned Charles floor maps.

Gabe Galson and Katie Westbrook conducted usability testing for the ongoing work on Library Search.

Kaitlyn Semborski and Geneva Heffernan continually monitor the usage our multiple  Social Media accounts (Instagram, Twitter and Facebook) to understand what works where, using that data to engage our various audiences effectively.  

The Virtual Reference Assessment was one of the Libraries’ many responses to the closing of the physical collections due to COVID-19. We put into place a more visible chat widget and a request button for getting help finding digital copies for inaccessible items. Olivia Given Castello, Kristina DeVoe, Tom Ipri, and Jackie Sipes worked on this popular service. Their assessment has led to multiple changes, including refining the routing of email requests and chat follow-up tickets. The work has also enhanced the FAQ system, engineered to come up automatically when staff answer an email ticket. This saves staff time as they can easily insert and customize the text in their replies to patrons. The Digital Copy Request system is more effective through coordination with Brian Schoolar (collections) and Joe Idell (document delivery). 

We improved the user experience for Request and Retrieval through our Library Search system. The project was led by Karen Kohn with team members Brian Boling, Carly Hustedt, Karen Kohn, John Oram, Jackie Sipes, and Emily Toner. With a goal of considering the entire experience, from making an online request to physically picking up a book, each team member brought important expertise to the project. Working remotely created challenges for some aspects of this project, like visualizing the pick up area at Charles. but they persisted. The clearer signage and instructions for use of self-checkout  improves the experience of staff as well. 

In addition to these projects, all profiled on our blog, Assessment on the Ground, there is much assessment work that goes on behind the scenes. For instance, we are in the process of reviewing our data collection practice through the Springshare forms. Staff involved in this initiative are Andrew Diamond, Katie Westbrook, Carly Hustedt and Tiffany Ellis, with input from Steven Bell, Olivia Given Castello, Justin Hill, Tom Ipri and Jenny Pierce

Richie Holland, Marianne Moore and Royce Sargent provided insights as I refined our approach to calculating and reporting expenditures for our many survey responses (IPEDS, ACRL, Temple University Fact Sheet, AASHL). 

Evan Weinstein, Margery Sly, and Josue Hurtado helped me access data collected in their work areas to better understand how our physical spaces and services were being used this fall, particularly important as we evaluate the use of the library buildings. 

Dave Lacy and I collaborate in our work with central IT staff for understanding Charles swipe data and how best we might connect Banner and library datasets to develop visualization dashboards in Tableau. 

Beckie Dashiell and Sara Wilson are patient collaborators as we continue to streamline our workflows with the University’s  Data Verification Unit. As essential as this function is, we all need patience when addressing their myriad questions like, “Where is your documentation for the 80 goat watchers you report attending the Instagram Philly Goat Project?” 

And there are important projects on the horizon. Gretchen Sneff is leading a team (Fred Rowland, Will Dean, and Adam Shambaugh) in an interview project with faculty working in the data science field. This important research, coordinated by Ithaka S+R, will combine our local data with findings from other institutions to understand research practice and potential for library services in this emerging area of need.

We are supporting our Library’s Student Advisory Board in a new way, providing a stipend for members.  This sends a powerful message to students about how we value their voice.  Thanks go to Jackie Sipes and Caitlin Shanley for leading this effort.

Finally, the Assessment Community of Practice sessions continue to be well-attended. Open to all staff, the forum provides a space for sharing our assessment work and asking new questions.

So… in spite of no formal plan, we continue to engage more staff in assessment projects, understand user needs in new ways, and develop our own expertise through team work.  All in all, a very good year for assessment here at TULUP. Thanks to all of my colleagues who contributed.


Posted in assessment methods, organization culture and assessment, service assessment | Tagged | Comments Off on The Year in Assessment at TULUP: A Celebration

The User Experience of Request and Retrieval

Earlier this year, a group was formed to consider ways to improve the user experience of requesting and retrieving items from the Charles Library BookBot. The group was composed of Brian Boling, Carly Hustedt, Karen Kohn, John Oram, Jackie Sipes, and Emily Toner. Karen led the group with UX support from Jackie. Our goal was to consider all aspects of the request/retrieval experience, from making an online request to physically picking up the book. We each brought different expertise, including knowledge of the service desk, the technology behind the request process, and the field of user experience research.

By the time the group convened, we already had a fairly long list of issues that we might address, identified by previous usability testing and staff focus groups. We reviewed the list and ranked each issue according to the potential impact on the user and the effort required by library staff to address it.  Shortly after we began meeting, the library closed its buildings due to covid-19, which affected our priorities and how we were able to work. However, with some adjustments we were able to complete three projects: Retrieval Times, Request Button Clarification, and Encouraging Self-Service at the One-Stop Desk.

Retrieval Times

We began with a relatively simple project to come up with language that would appropriately set patron expectations around retrieving a book from the BookBot. We knew from focus groups we had conducted with public services staff that they were fielding many questions about how long retrievals would take, and that their responses ranged from ten minutes to an hour.

To decide on a message, we first needed to learn how long requests were actually taking, which we did by looking at data that Karen had compiled on requests and retrievals made from the start of the Fall semester 2019 to the March closure. Looking only at requests made while the crane was in operation, we saw that more than half of requests were delivered within 5 minutes and 87% within 20 minutes. The average retrieval time was just under 23 minutes.

Next we needed to turn the numbers into a concise message for patrons. We conducted a structured group brainstorm, where each of us wrote our own version of a message that reflected the average retrieval times we saw in the data. We then shared our individual messages with the group. The chat window in Zoom works well for this process, which became a very familiar one for us! By noting what we liked about each other’s wording, we came to consensus on the following message:

“The Bookbot typically delivers items within 20 minutes. Requests placed outside of operating hours will take longer.”

Unfortunately, because the library was closed at the time, it did not make sense to add this message to the website. We expect that the time it takes to retrieve an item may be somewhat different now, due to the absence of student workers to help with the process and the lower volume of requests. We hope, however, that we can use similar phrasing in the future with an updated estimate of retrieval times.

Request Button Clarification

Our next project addressed an ongoing problem with the Request feature in Library Search. Users often could not tell which items were requestable and which were not, and the website did not explain the logic behind why certain items could not be requested. We’d heard from public services staff that items in the fourth floor open stacks were particularly problematic; users try to request those items and can get frustrated or confused when that option turns out not to be available. After Emily explained some of the technical constraints that impact how request options are presented, we had a better sense of the scope of potential changes we could suggest. At this point, we left open the possibility that the solution could be either a change in wording or in the functionality of the Request button.

Because there were several different ways we could potentially approach this problem, the group took some preparatory steps before brainstorming solutions. First we wrote a problem statement, which defined the problem as being related to both user expectations and communication. Next we reviewed logs of virtual reference questions. Karen arranged the logs on a virtual whiteboard, which allowed us to cluster “sticky notes,” putting similar questions near each other. The reference questions confirmed what we’d heard from staff already – they were indeed getting a lot of questions from users attempting to use the Request button for items on the 4th floor of Charles! Reading through these reference transactions also provided us with some interesting new information. Patrons do not actually mind retrieving items themselves from the fourth floor; they just don’t know that this is what they are expected to do. Self-service does not need to be presented apologetically. Another finding is that while we’d initially seen communication as an issue, staff had many successful ways of communicating to patrons the need to retrieve items themselves.

Patron questions represented on clustered virtual post-it notes

Patron questions represented on clustered virtual post-it notes

Our next step was to clarify for ourselves the policy regarding self-service, using a Five Whys exercise. Using several use cases, we took turns asking “Why can’t I request this?” and then countering the answer with another “But why?” We had fun pretending to be challenging patrons, and as we did so we started to see the logic of why certain items or locations are requestable and others not. We realized that, despite the complicated programming logic behind how the Request button worked, the human logic was relatively simple: an item is not requestable if we believe the patron can get it themselves (i.e., it is in open stacks on the patron’s home campus).

With the situation clearer in our minds, we were able to brainstorm solutions. We changed the text on the button from Request to How to get this. We wanted to use language that conveyed that requesting is not the only way to get an item. For much of our collection, there are a variety of ways to obtain a desired title.

a screenshot of the availability section of an item Library Search that shows the new button language how to get this

How to get this button in Library Search

With design support from Rachel Cox and more group brainstorming (we got very good at brainstorming phrasing together) we added information about retrieving items from open stacks. When a user clicks the How to get this button for an item in any open stacks location, one of the options they now see is Find item on the shelves. The text instructs the user to “Close this window to view the location and call number, then find the item using this information.” An added benefit of this new design is that the How to get this button provides a place to offer a range of options for obtaining an item. After the building reopened in August and our books were once again available in physical form, we continued to offer the popular Get Help Finding a Digital Copy service alongside the options for getting a physical copy. This service is now offered as a link within the How to get this menu.

Screenshot of the menu that appears in Library Search after a user clicks the How To Get this button

Menu that appears after clicking the How to get this button

Future assessment is needed to determine if these changes helped to clarify the request menu options for patrons.

Encouraging Self-Service at the OSAD and Hold Shelf

Several of the issues we had previously identified as high-priority related to patrons not realizing certain services were designed to be self-service, such as picking up requests from the Hold Shelf. As Charles Library reopened to patrons in August, the group looked for ways to encourage self-service in order to reduce person-to-person contact between patrons and library staff.

Because we wanted to move quickly on this project, we did not follow all the steps of a formal design-thinking process. We identified the most critical information for successful self-checkout and then brainstormed how to communicate that information at key touchpoints. To encourage self-service, we wanted to communicate five messages to patrons:

  1. Go directly to the Hold Shelf
  2. Books are alphabetical by the first four letters of your last name and last 4 digits of your TUID
  3. Books are not yet checked out to you
  4. Please use the self-checkout machine
  5. Return items on the cart

These messages were incorporated into the whiteboard signs near the desk, which Katerina Montaniel and Emily Schiller redesigned. Carly also arranged for the paper sleeves on Resources Sharing books to contain a note telling patrons to please check out the item. She also designed 8.5” x 11” signs to sit in plastic holders on the Hold Shelf saying “Please remember to check out your items.” Jackie and Rachel Cox worked on signs for the self-checkout machines identifying them as such. As most of our team members were not working on-site, we relied heavily on photographs from John Oram of the OSAD/Hold Shelf area, as well as assistance from Carly and Cynthia Schwarz for sign placement.

Whiteboard sign next to the One Stop desk that explains to users how to locate and checkout their items on the hold shelf

Hold Shelf sign created by Emily Schiller

Unlike the previous project, we started this one with a clear sense of the problem and did not need to spend time defining one. Our goal was to nudge patrons toward self-service in the hopes of limiting contact and creating a safe and healthy environment for everyone in the building. However, data from LibInsight questions recorded at our service desks was helpful in understanding which parts of the pickup and checkout experience were confusing for patrons.

We have already begun to assess the effectiveness of our solutions with a few different strategies. We surveyed OSAD staff about the perceived effectiveness of the whiteboard signs and made some changes based on this feedback. Brian Boling created a report using Alma Analytics of checkouts from Spring and Fall 2020, with a breakdown of staff-mediated vs self-checkouts. The reports showed us that even before our interventions, patrons were already substantially more likely to use the self-checkout machines than they were in the Spring semester. We plan to use this report as a baseline to see if future changes will make the percentage of staff-mediated checkouts decrease even further.

The group is on pause right now, but some of our recommendations will be passed on to others in the Libraries, and we hope to keep assessing the effectiveness of the changes we’ve made. Learning about and following the design thinking process has been enjoyable and using data to make improvements to our services feels satisfying. We hope our work has benefited our patrons and colleagues.

Posted in access, assessment methods, data-driven decision making, library spaces, user experience | Tagged , | Leave a comment

Working Together for Improvement: The Digital Access Workflow

When the library closed its physical doors in March, new doors of the digital sort opened up. Yet the disruption of access service for physical materials, lasting several months,  has yielded a re-working of processes for how we get our students and faculty the resources they need for their teaching and learning. 

For this month’s post, the heads of Charles Library Access Services, Acquisitions & Collection Development, and Learning & Research Services’ social science unit (Justin Hill, Brian Schoolar & Olivia Given Castello) sat down with me to discuss recent improvements in how we provide patrons access to digital materials.

It started with the Get Help Finding a Digital Copy service, initiated when we closed the library buildings. When a patron is searching the library catalog and discovers a physical item of interest, Get Help Finding a Digital Copy appears as an option.  

The request is routed to a virtual reference staff member who reviews multiple sources to find and point the patron to that electronic version of their desired item. When the Libraries had access to the HathiTrust Emergency Temporary Access Service, over 40% of our print collection was available digitally. And of course, there are other sources for e-books, both open access and for purchase.  Learning & Research Services (LRS) librarians, and other virtual reference team members, were busy fielding dozens of requests each day for these digital copies.  This service continues to be incredibly popular. 

How did this success lead to a change in workflow?  As summer went on and emergency access options were expiring, the success rate for Get Help Finding a Digital Copy request fulfillment declined. LRS and Collections Management staff collaborated to design a new workflow that involved Acquisitions staff more directly in the fulfillment process. This allowed them to maximize the possible purchase options and improve the fulfillment success rate.

At about the same time, the Access Services department was moving to provide all digital copies for course reserves. In the course of providing faculty with options for their course reserves, they also took advantage of this new workflow by steering the requests for e-books to Acquisitions.  

Moving to electronic course reserves opened up other opportunities, like introducing both faculty, staff and students to our services for scanning book chapters and sending them directly (and quickly) to the patron via document delivery.  Even better, faculty will learn how to get their course reserves on Canvas so that students have ready access to the materials. 

What made these collaborations between departments work?  

  • Good communications between the departments to facilitate the best solution to a problem.
  • Willingness of staff to bring their expertise to develop the most efficient workflow and to work together in new ways. 
  • And of course, shared value for creating an excellent experience for users.

So how is this assessment? Reflecting on our work and how it might be improved is an important kind of assessment. There are also numbers to show increasing requests and improved turn-around time for those requests.  Additionally, we can see success in the many thank you notes received via email, high satisfaction ratings on virtual reference, and most importantly, the pride of continually improving our services to patrons, even when challenged by disruption.  


Posted in access, digital collections, organization culture and assessment | Tagged , , | Leave a comment

Steering Straight: Continuous Improvement and the SSTs

It’s been almost four years since we established the first Strategic Steering Teams at Temple University Libraries/Press. Those first two groups, Research Data Services and Scholarly Communication, are now part of a group of six including: Outreach and Communications, Learning and Student Success, Collections Strategy, and Community Engagement. Over 60 staff members from throughout the organization have participated as a team member or leader, and many more have been engaged with subgroup projects. 

One of the things that we do annually is an informal “assessment” of how the teams are doing.  We’ve done this in different ways. I have regular one-on-one conversations with team leads, we meet together, and the team leads conduct check-ins with their teams. While these are not formal assessments, we strive to be open to discussing what’s working and what’s not working so smoothly. 

Here’s a summary of recent conversations with Will Dean, Annie Johnson, Vitalina Nova, Brian Schoolar, Caitlin Shanley, and Sara Wilson. 

How is the team going? What’s working well for you as a team leader?

For the most part, teams are going well. Activity slowed down during the summer, and the pandemic has also had a real impact, particularly for those with children or other additional responsibilities while working from home. More time is being spent at meetings checking in with one another. One of the values expressed more than once was the team members’ comfort level with one another, so that these meetings serve as “safe” spaces for sharing concerns and anxieties about what’s going on. 

This is a time when new members are brought into the group, and this means adjustment and re-grouping. Strategies for doing this are:

  • Review of the charge and reworking of goals
  • Evaluation of goals and projects with an eye towards deciding what to continue and what to let go of
  • Establishing new project groups, particularly for new members with new interests, to take on

What, if any, are the challenges?

In this environment, it may be hard to feel connected to how the university is functioning when we are so far apart. 

The membership structure for the teams is designed to allow for new members to join each year, although there is no fixed term for staying on the team. The teams may find that balancing new initiatives with ongoing work can be tricky, particularly as new members come on board. Some members may want to stick with the “tried and true” and others want to start new projects. 

Where do you see the group’s work focusing in the next year? What kind of support would be useful to your team in moving forward with its goals?

Most groups are finalizing priorities and goals for the upcoming year now. It was agreed that having a clear sense of the Library/Press’ strategic directions and priorities will be important for the teams’ planning. The leads confirm that the Strategic Steering Teams are an effective way of moving forward on strategic initiatives without the “administrative overhead” of a department. 

There are areas, like research data services and scholarly communication, where the services and training would just not happen with the “legwork” of the team. 

For team leaders, who do not formally supervise team members, it can be a challenge to delegate tasks, and to ensure that team members do the tasks they commit to. There is not an agreed-upon time commitment. It varies by group and by individual. While the team leads serve on the Libraries/Press Administrative Council, they are leading teams, not departments. They lack a “clear path” for acquiring budget resources to do their work. 

In spite of these challenges, the effectiveness and value of the teams’ contribution to the organization is most clearly demonstrated by their work supporting our strategic objectives.  Take a moment to review all they are doing, at:

Strategic Steering Teams on Confluence


Posted in organization culture and assessment | Tagged , | Leave a comment

The Future on Pause: Reflections on the “How We’re Working at Charles” Project

Last week the Assessment Community of Practice gathered virtually to hear more about the Envisioning our Future project. The session was hosted by research team members Karen Kohn, Rebecca Lloyd, Caitlin Shanley, and myself. 

The project was conducted as part of the assessment initiative sponsored by the Association of Research Libraries to understand the impact of library spaces on innovative research, creative thinking and problem solving.  Coinciding with the opening of the Charles Library at Temple, we focused our research on how changes in library space impact the work of staff : their work as individuals, when working with colleagues, and in their work with users.  

Prior to the move we asked staff members, in one-on-one interviews, to imagine how their work would change upon moving to the new facility with spaces that support a quite different approach to service and resource delivery.   A second set of interviews was conducted in early 2020, after we’d been in the space for a semester.   Then in March 2020, the Libraries closed all its buildings. While many of our findings seem part of a now distant past, others went beyond the use of physical space and are as relevant as ever. 

The COP was an opportunity for the research team to share insights and reflections on the project.  The full report was shared with staff (see July 23 email), so the discussion focused on the approach. Those insights and reflections from the discussion are paraphrased here: 

What were some of the benefits for you in participating in this project?

It was helpful to know that our personal experiences were, in many cases, shared by our colleagues. From the control of window shades to norms for talking in shared spaces, it’s good to know that we’re not alone in our feelings of uncertainty. 

Being part of a research team provides access to a level of detail and complexity about the issues. Seeing patterns in the interviews helped us to think about solutions.

It was also nice to be part of a project that participants felt was supportive, providing an opportunity for staff to express their feelings about Charles in a safe  way. 

What were the challenges experienced by the team members? 

Qualitative research produces a rich body of text, and while we were appreciative of participants’ willingness to be candid, open and trusting of us with their thoughts – it can be challenging to distill that material without losing the richness of the sentiments that were shared. And people are human, so they’d say contradictory things, even in the course of one interview. 

We were close to the research. When interviewing our colleagues, it could be hard to keep a distance, be an observer. Oftentimes we’d empathize with what was being said, and yet we had to stay objective when listening and when presenting the material. In conducting the interviews, it was necessary to build trust in a short period of time. That’s a skill that will be helpful in other contexts.

It is also good to know that we are part of an  ARL research cohort. We’re hopeful that our work will be helpful to other libraries and will contribute to our colleagues at other institutions conducting similar projects. Libraries have a lot to learn about self-reflection, and thinking of themselves as organizations. 

Other thoughts from the Community? 

We noted that the report’s findings related to communication around change continue to resonate, as powerfully now as then. We are operating in a working environment that is volatile, requiring us to be thoughtful in how we insure direct and effective communication at all levels of the organization. Many of us are working in the Charles physical spaces, but most are not. While the physical spaces didn’t allow us to be all together, the virtual space does! This unexpected future provides for opportunities to be creative in communicating, connecting and establishing work norms together in new, and even more inclusive, ways.  

Posted in library spaces, qualitative research | Tagged , | Comments Off on The Future on Pause: Reflections on the “How We’re Working at Charles” Project

What Counts as Reference?

Reference desk from 1982.

Reference Desk. 1982. Paley Library. From Temple University Libraries, Special Collection Research Center.

Last month I completed six years of service on the editorial board of ACRL’s Academic Library Trends and Statistics Survey. Our meetings involved much discussion on how best to provide clear instructions to survey participants, debates over wording of trends questions, and work with ACRL staff in recruitment efforts to insure a robust response rate (this last year it was 1,676).  We focused mostly on new metrics of potential interest, like the number of computers provided by the library. Or new formats for instruction. We didn’t talk much about the definition of a Reference Transaction – a number requested also by the Association of Research Libraries, Association of Academic Health Sciences, and IPEDS, the Integrated Postsecondary Education Data System (more commonly, IPEDS). 

The definition all of these surveys use is one modified from the ANSI/NISO Z37.7 definition, updated last in 2004. 

An information contact that involves the knowledge, use, recommendations, interpretation, or instruction in the use [or creation of] one or more information sources by a member of the library staff. The term includes information and referral service. Information sources include (a) printed and nonprinted materials; (b) machine-readable databases (including computer-assisted instruction); (c) the library’s own catalogs and other holdings records; (d) other libraries and institutions through communication or referral; and (e) persons both inside and outside the library. When a staff member uses information gained from previous use of information sources to answer a question, the [transaction] is reported as a [reference transaction] even if the source is not consulted again.

Survey instructions make very clear that we do not count “directional” questions, those questions about the “logistical use” of the library. Examples of directional questions are:

  • “Which way is the restroom?” 
  • “Where is the nearest printer?”

Reference is counted when we are “looking up” a piece of information:

  • “Does the Library have a copy of Ivanhoe?”  
  • “What are the library’s hours today?”

Time and complexity don’t really count. ACRL has us distinguish between “reference” and “consultation”, but ARL does not.  Some libraries (like ours) define a consultation as a transaction that is complex and takes time. Others count a consultation as transactions for which a patron makes an appointment.

When we tally it all up, should looking up the hours on the library website count the same as a 1-hour consultation on the use of R at the Scholars Studio? Does working with a faculty member on defining the parameters of a systematic review count the same as looking up a known item in Library Search? What about the instruction of a faculty member in how to place an item on reserve in Canvas? ARL counts these the same, although one may take a staff member less than a minute, the other hours. Some reference questions require more training and specialized expertise. 

Our patrons are sometimes surprised to learn that behind the “curtain” of our online Chat Service, or our Digital Request Form, a human being is waiting to assist. As my colleagues described so well in the last blogpost, our numbers for reference are exploding, and we have many many thankful patrons helped by expert information searchers using their knowledge of the many information sources available to help them. 

But what if that automatically populated form was sent in an automated way to a federated search across the many information resources we provide? And no human was involved? And the patron found just what they were looking for? Would our robot get to count that as a reference question? 

What if our easy-to-use FAQ, or our LibAnswers, were so well-developed that a patron’s search query always mapped to the answer they sought? Do we get to count that? Is the only thing that counts a transaction that involves a human being?  

There was a time when most reference required the patron go to the physical reference desk. Behind the desk were massive shelves of reference books, non-circulating, and the job of reference was to match the question to the appropriate volume. As a reference librarian, I’d  often go to the shelves myself and serve up the book to the [thrilled] patron myself. The dark ages of librarianship!

Perhaps it’s time to rethink how we develop, measure and assess the ways in which our expertise supports the reference services we provide, whether physical or virtual.  

Posted in statistics | Tagged , | Leave a comment

Supporting Online Learning and Research: Assessing our Virtual Reference Activities

Today’s post is contributed by Olivia Given Castello, Tom Ipri, Kristina De Voe and Jackie Sipes. Thank you!

The sudden move to all-online learning at Temple University presented a unique challenge to the Libraries and provided a great opportunity to enhance and assess our virtual reference services. Staff from Library Technology Development and Learning and Research Services (LRS) put into place a more visible chat widget and a request button for getting help finding digital copies of inaccessible physical items.

Learning & Research Services librarians Olivia Given Castello, Tom Ipri, and Kristina DeVoe, and User Experience Librarian Jackie Sipes have been involved in this work.

Ways we provide virtual reference assistance

We are providing virtual reference assistance largely as we already did pre-COVID-19. We offer immediate help for quick questions via chat and text, asynchronous help via email, and in-depth help via online appointments. See the library’s Contact Us page for links to the many ways to get in touch with us and get personal help.

Our chat service now integrates Zoom video chat and screensharing. That was part of a planned migration that was completed just before the unexpected switch to all-virtual learning.

Since going online-only, we have also launched a new access point to our email service. By clicking the “Get help finding a digital copy” button on item records in Library Search (Figure 1), patrons can request personal help finding digital copies of physical items that are currently inaccessible to them. 

Figure 1. The “Get help finding a digital copy” button in Library Search, Summer 2020.

Usage this year compared to last year

The main difference we’ve seen since going online only has been in the volume of virtual reference assistance we are providing. We added a more visible chat button to the library website and Library Search. Since making that live, we have seen 88% more chat traffic than during the same period last year (Figure 2). The “Get help finding a digital copy” button also led to an enormous increase in email requests (Figure 3). Since that was launched we have seen more than a sevenfold increase in email reference. At the height of Spring semester, we received 347 of these requests in one week.

Figure 2. Volume of chat reference transactions compared for the same weeks of Spring/Summer semester in 2019 and 2020.


(Figure 3. Volume of email reference transactions compared for the same weeks of Spring/Summer semester in 2019 and 2020.)

Figure 3. Volume of email reference transactions compared for the same weeks of Spring/Summer semester in 2019 and 2020.

Our team has handled this increased volume very well. When we first went online-only we made the decision to double-staff our chat service, and that turned out to be wise. We also have staff from other departments (Access Services and Health Sciences) single-staffing their chat services so that we can transfer them any chats that they need to handle, or transfer them chats if there happen to be many patrons waiting.

Email reference handling is part of the chat duty assignment, so the double-staffing has also served to help handle the increased email volume. Outside of chat duty shifts, the two other disciplinary unit heads (Tom Ipri and Jenny Pierce) and I are doing extra work to handle emails that come in overnight. Our two part-time librarians, Sarah Araujo and Matt Ainslie, both handle a large volume of chat and email reference and we are grateful for their support.

Types of questions we receive 

Since April, about 75% of email reference requests are for help finding digital copies of books and media submitted through our “Get help finding a digital copy” button that is embedded in only one place: Library Search records. The remaining 25% include a diverse range of questions about the library and library e-resources.

The topics patrons ask about in chat and non-“Get help finding a digital copy” email reference vary somewhat depending on the time of year. Overall, about 40% of the questions patrons ask are about access to materials and resources, particularly articles. About 5% of questions appear to come from our alumni, visitors, and guests, which shows that outside communities seek virtual support from us.

During the period since we’ve been online-only, we received questions that mirror the proportions we’ve seen all year long. However, 45% of the alumni/visitor/guest questions, and about 44% of the media questions, we have received this year have been during the online-only period. 

Analyzing virtual reference transactions to understand user needs

Our part-time librarians, Sarah Araujo and Matt Ainslie, led by librarian Kristina De Voe, have created and defined content tags for email tickets and chat transcripts. They systematically tag them on a monthly basis, focusing on the initial patron question presented, and have also undertaken retrospective tagging projects. The tagging helps to reveal patterns of user needs over time. For example, reviewing the tags from questions asked during the first week of the Fall semester in both 2019 and 2018 show a marked increase in questions related to ‘Borrowing, Renewing, Returning, and Fines’ in 2019 compared to the prior year. This makes sense given the move to the new Charles Library, the implementation of the BookBot, and the updated processes for obtaining and checking out materials (Figures 4 and 5).

Figure 4. Tagged topics represented during the first week of Fall 2019 semester [Aug 26 - Sept 1, 2019]. Number of chats & tickets: 125. Number of tags used: 144.

Figure 4. Tagged topics represented during the first week of Fall 2019 semester [Aug 26 – Sept 1, 2019]. Number of chats & tickets: 125. Number of tags used: 144.

Figure 5. Tagged topics represented during the first week of Fall 2018 semester [Aug 27 - Sept 2, 2018]. Number of chats & tickets: 107. Number of tags used: 136.

Figure 5. Tagged topics represented during the first week of Fall 2018 semester (Aug 27 – Sept 2, 2018). Number of chats & tickets: 107. Number of tags used: 136.

Analyzing virtual reference transactions also allows us to aggregate and analyze the language patrons use when searching and communicating with us — via text analysis or simple word cloud tools. Understanding language used can better inform us of how users interpret our services as well as how we might more effectively communicate with them across various platforms.

(Figure 6. Word cloud of approximately 100 most frequently used words in chat transcripts during the move to online-only period [March 16-June 30, 2020]).

Figure 6. Word cloud of approximately 100 most frequently used words in chat transcripts during the move to online-only period (March 16-June 30, 2020.

We have reviewed “Get help finding a digital copy” requests at two points in time to ascertain how often we are able to find a digital copy (about 50% of the time), what other suggestions we make to patrons, such as referring them to Interlibrary Loan for chapters or working with a subject librarian to find alternative and available books, and to fine tune our request handling.

With a colleague from Access Services, Kathy Lehman, we also analyzed email transcripts from this academic year in order to refine our process for passing reference requests between LRS and Access Services.

We do not systematically re-read email and chat transcripts beyond discrete projects like this, except when there is some new development related to a particular request that requires we review the request history.

We analyze anonymous patron chat ratings and feedback comments, as well as patron ratings and comments from the feedback form that is embedded in our e-mail reference replies. Some librarians also send a post-appointment follow-up survey, and we analyze the patron ratings and comments submitted to those as well. Patron feedback from all these sources has so far been overwhelmingly positive.

Changes to the service based on our analyses 

We have refined our routing of email requests, and chat follow-up tickets, based on what requests we are seeing and the experiences of staff. In our reviews of “Get help finding a digital copy” requests at two points in time, we made suggestions to staff members as a result of our review at Time 1. Then we later found there was an improvement in request handling at Time 2, as a result of these adjustments.

We developed a suite of answers, as part of our larger FAQ system, and engineered them to come up automatically when we answer an email ticket. This saves our staff time, since they can easily insert and customize the text in their replies to patrons.

Guidance for referring to Access Services was improved, particularly when it came to referring patrons to ILLiad for book chapter and journal article requests and Course Reserves for making readings available to students in Canvas. We have also streamlined how we route requests that turn into library ebook purchases or Direct to Patron Print purchases, and we are working with Acquisitions on a new workflow that will proactively mine past “Get help finding a digital copy” request data for purchase consideration.

Using virtual reference data to learn about the usability of library services 

Analyzing virtual reference transactions can also provide insight into how users are interacting with library services more generally, beyond just learning and research services. Throughout spring and summer, virtual reference data has informed design decisions for the website and Library Search. 

One example is the recent work of the BookBot requests UX group. The group, led by Karen Kohn and charged with improving item requests across physical and digital touch points, used virtual reference data to better understand the issues users encounter when accessing our physical collections. This spring, we focused on how we might clarify which items are requestable in Library Search and which items require a visit to our open stacks — an on-going point of confusion for users since Charles Library opened.

The data confirmed that the request button does create an expectation that users can request any physical item. Looking at the transactions, we also saw that users did not mind having to go to the stacks, but they simply didn’t always understand the process. We realized that our request policies are based on the idea of self-service — if a user can get an item themselves, it is typically not requestable. One outcome of this work is new language in the Library Search request menu that instructs users about how to get items from the browsing stacks themselves. 

Next steps for assessing virtual reference service

We are working on several other initiatives this summer. One is a project to test patron’s ability to find self-service help on our website. Hopefully it will lead to suggestions for improvement to our self-service resources and placement of online help access points. We have also made revisions to the “Get help finding a digital copy” request form based on feedback from staff, and changes to the placement of the request button are planned related to our Aug. 3 main building re-opening. It will be helpful to test these from the user perspective once they are live.

Posted in process improvement, research work practice, service assessment, usability | Tagged , , | Leave a comment

We All Make Mistakes

Last week I learned a lesson about making mistakes, and it was both humbling and helpful. Just one day before the deadline for locking the University’s numbers into the IPEDS system (Statistics for the U.S. Dept of Education) for FY18-19, I was contacted by the University’s director of data analysis and reporting. “Where are the libraries’ numbers? “After a brief email exchange, password in hand, I was quickly able to input those numbers – prepared months ago for other purposes – ARL, ACRL, AASHL.

Annoying, each agency asks for data sliced and diced in different ways. Sometimes we separate out physical and digital titles, sometimes we separate articles and books in reporting interlibrary loan transactions. Reference can be most complicated, with data coming from multiple systems and channels (SMS, Chat, Analytics. LibAnswers), Excel spreadsheets, manual reports). 

But I felt confident in my IPEDS numbers, and the data input was easily completed. I reported back to Institutional Research and Assessment, and pointed them to the required backup documentation – multiple spreadsheets, reports from Alma, Read-Me files. From year to year,  if numbers seem out of line with previous years’ reports, those anomalies need explanation. For instance, I noted that physical circulation  declined due to the closing of Paley library. All good.  Next step, the data is AGAIN verified by the University Data Verification Unit. DVU provides another thorough audit, also requiring documentation to back up each number.

At 4:45 the day the numbers are due, DVU discovers an error. In calculating the total monographic expenditures for Law, HSL and Main libraries, I double counted two figures. I felt stupid, of course. But the error was easily fixed, verified by the Unit, and at 5:07 pm, the University’s data was locked. Yeh!

A long story, but I learned a couple of things. While the University-mandated data verification process is sometimes annoying, especially when time is tight, there is real value in having an external reader to double-check formulas, data input, and logic. No one is perfect. Internally here in the libraries,  I’ve begun the practice of my own verification – so I will double-check numbers provided to me. I want to understand so I can explain to others. 

It is equally important for those “on the ground” to help me understand the numbers.  Why did circulation go down? Why did interlibrary loan go up? What happened on March 19 that caused our gate count to plummet? What was the impact of making our  webchat more visible? 

When we ask for documentation, it is not to be mistrustful or to create extra work. It ensures that the data we report for surveys, to accrediting bodies, for funding agencies and to our professional associations  is as accurate and reliable as we can make it. 

I don’t believe that mistakes are a good thing. But I learn more from my mistakes than pretending I don’t make them. I’m much better off when I am willing to ask for help, allow time for others to check my work, and consider the perspectives (and expertise) of my colleagues. And next time, maybe I’ll remember to keep my thumb off the camera lens. 

Posted in statistics | Tagged , | 2 Comments

Using Social Media to Engage Library Users

Today’s very special post is authored by Kaitlyn Semborski and Geneva Heffernan, from Library Outreach and Communications at Temple Libraries. 

At Temple Libraries, we use social media to build and maintain relationships with library stakeholders. Daily, our Instagram, Twitter, and Facebook platforms allow us to engage with students, faculty, staff, and community members through posts, replies, comments, and more. As we grow our audience, it is increasingly important to regularly track and evaluate our strategies and interactions on each platform to best serve them. 

We learn a great deal from tracking social metrics. First, we gain insight into our audience. Who are they? What do they like? What content do they interact with the most? What questions do they have for us? When are they online? Knowing our audience directly informs the type of content we create and share. The things faculty seek on social media often differ from the things undergraduate students seek. We work to cater to those disparate interests. 

There are some topics that span across audiences. For example, the number one shared interest of our followers on Twitter is dogs. This tells us that posting about National Love Your Pet Day or National Puppy Day will likely go over well with our followers (and they both did). 

Given our segmented audience, we commit to having some content for each subgroup, rather than having all our content interest everyone. For example, posts promoting specialized workshops tend not to perform the best in terms of engagement. This may be because the majority of our followers do not fit into the small niche of that particular subject (for example most might not know what PubMed, Gephi, or QGIS are) and are therefore less likely to engage with our post promoting it. Does this mean we should stop promoting the variety of workshops offered through the Libraries? We think not. The metrics show us that the audience segment interested in those posts is smaller, but we still value promoting our opportunities to all the Libraries’ patrons. 

It is important to note that our sole goal for social media is not to get the most “likes.” If that were the case, we would only post photos of puppies reading books all day. While we like to increase engagement on our social platforms, our ultimate goal is to use social media to increase engagement with our online and in-person services across our libraries. Social media is one of the most direct ways we have to engage with our users online, and we want to inform them about what the Libraries are doing to serve them. 

Each social media platform we use (Twitter, Facebook, and Instagram) provides native analytics and each scheduling platform we use (Later and Hootsuite) has its own metrics collection. In order to stay consistent with what we track, we collect our metrics in a spreadsheet, independent from the platforms themselves. This gives us the freedom to evaluate and compare data across platforms.  

Likes and followers by platform

Assessment practice at-a-glance:

  • Weekly updating of metrics spreadsheet
  • Monthly tracking of followers on each platform
  • Twice yearly thorough review of each platform and evaluation of what is working well and what is not

While tracking varies by platform, here are samples of what goes into our spreadsheet:

  • Likes
  • Shares
  • Engagement rate
  • Comments
  • Reach
  • Content type

Instagram posts over time

So, what are some changes we made and improvements we have learned from our analytics insights? We learned that Facebook is for storytelling. That means posts about university and library news, as well as event updates after an event are what our audience wants.

Facebook Insights

Facebook Insights Example 1

Facebook insights

Facebook Insights Example 2


Twitter is a platform for news and conversation. It is where announcements are made and questions are asked. We have learned to go to Twitter first to spread pithy, important information, such as the closing of all our physical locations. It is also a place where followers can ask questions of us and know they will get accurate responses. 

Twitter Post Example 1

Twitter Post Example 2

Twitter Post Example 3


We’ve learned that on Instagram people want pretty pictures. It is a visual platform and people engage with a post only when they are drawn in by the visual. Because of this, we have been emphasizing photos taken by the university photographers or user-generated content that we are tagged in that are already strong photos. 

Instagram Post Example 2

Most of all, social media metrics tracking is a form of feedback about the Libraries as a whole. When we evaluate our interactions with our community on social media, we learn about what they need from us and what they like about our work. The metrics reflect interest in the Libraries. People using our resources are more likely to engage with our social media presence. As our number of users grow, so do our followers. As buzz grew around the opening of Charles Library, engagement with our content reflected that buzz. We work hard to show off the great work being done by our staff and the great work brings more attention to our channels of communication. There is always room for improvement, and we will keep striving for it.

Posted in data-driven decision making, statistics, web analytics | Tagged , | Leave a comment

A New Day for Assessment Practice?

sunrise from airplane

It is difficult to believe that in early March we convened the Assessment Community of Practice, joining Margery Sly and Matt Shoemaker to talk about changing needs for assessment measures as we develop new library services. The new Charles Library affords us the opportunity to offer more facilities, technologies, and expertise.  We talked about how best to assess the impact of those new types of spaces on our community.  We agreed that by necessity, much of our “assessment” is counting: the numbers of visitors to the reading room, attendance at instruction and workshops, use of physical collections, use of computers and specialized software in the Scholars Studio. 

We talked about the differences in academic departments who had more or less interest in our offerings. Some faculty take advantage of special collections and the instruction offered on use of primary resources. Others find value in new types of research questions and collaborations made possible through the Scholars Studio.

In just three weeks, this important discussion seems less relevant. The questions continue to be useful – how best to gauge the usefulness and long-term impact of our services on the students, faculty and community we support?  But even the most basic of measurements: the gate counts, the use of physical materials, the attendance at in-person workshops and instruction sessions – these are no longer available to us.   There are no physical bodies to count. There are no hands-on workshops to evaluate. 

This is a loss, of course. (I hate to think how our library trend-trackers like the Association of Research Libraries will accommodate this year’s statistical anomaly.) But for Temple, it provides an opportunity to explore our questions in new ways, with new tools. We are impelled to think about how to mine our web analytics data more deeply. We continue to have access to data related to the use of the website, our discovery systems, our licensed resources and the many channels of social media output from the library. Springshare and Ezproxy provide us with tools on the use of library-curated content and collections.

Demonstrating the use of our expertise in providing access, research and instruction support takes a very different shape now. It also provides us with a testing ground for many of the initiatives that are already underway. Instructors of English 802 will be in a much better position to help us improve our online version of that library workshop.  The Health Sciences Libraries quickly transitioned to Zoom versions of their popular workshops – perhaps making these even more accessible to busy students and faculty.  Jackie Sipes is exploring ways of doing remote usability testing of Library Search and other online discovery tools. 

Just a week ago the libraries had a physical space to which students, faculty and community could come. We were solid. Our buildings and physical spaces staffed with humans had a presence that signified the essential place of the Library on the campus. Now that place may not be as obvious to our users.  At least for the near term, we will need to re-imagine how the library positions itself and how we demonstrate that continued impact and value to our community. 

Posted in library spaces, statistics, web analytics | Tagged , | Leave a comment