
Today’s very special post is authored by Kaitlyn Semborski and Geneva Heffernan, from Library Outreach and Communications at Temple Libraries.
At Temple Libraries, we use social media to build and maintain relationships with library stakeholders. Daily, our Instagram, Twitter, and Facebook platforms allow us to engage with students, faculty, staff, and community members through posts, replies, comments, and more. As we grow our audience, it is increasingly important to regularly track and evaluate our strategies and interactions on each platform to best serve them.
We learn a great deal from tracking social metrics. First, we gain insight into our audience. Who are they? What do they like? What content do they interact with the most? What questions do they have for us? When are they online? Knowing our audience directly informs the type of content we create and share. The things faculty seek on social media often differ from the things undergraduate students seek. We work to cater to those disparate interests.
There are some topics that span across audiences. For example, the number one shared interest of our followers on Twitter is dogs. This tells us that posting about National Love Your Pet Day or National Puppy Day will likely go over well with our followers (and they both did).
Given our segmented audience, we commit to having some content for each subgroup, rather than having all our content interest everyone. For example, posts promoting specialized workshops tend not to perform the best in terms of engagement. This may be because the majority of our followers do not fit into the small niche of that particular subject (for example most might not know what PubMed, Gephi, or QGIS are) and are therefore less likely to engage with our post promoting it. Does this mean we should stop promoting the variety of workshops offered through the Libraries? We think not. The metrics show us that the audience segment interested in those posts is smaller, but we still value promoting our opportunities to all the Libraries’ patrons.
It is important to note that our sole goal for social media is not to get the most “likes.” If that were the case, we would only post photos of puppies reading books all day. While we like to increase engagement on our social platforms, our ultimate goal is to use social media to increase engagement with our online and in-person services across our libraries. Social media is one of the most direct ways we have to engage with our users online, and we want to inform them about what the Libraries are doing to serve them.
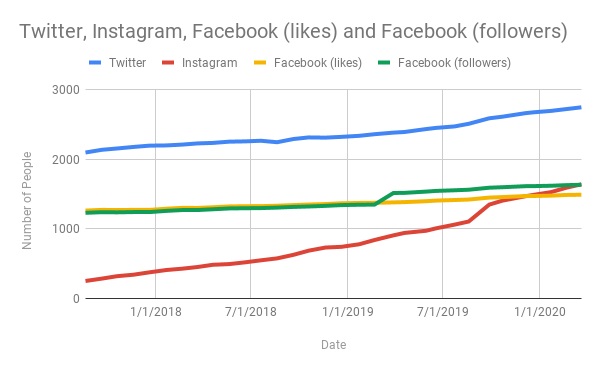
Each social media platform we use (Twitter, Facebook, and Instagram) provides native analytics and each scheduling platform we use (Later and Hootsuite) has its own metrics collection. In order to stay consistent with what we track, we collect our metrics in a spreadsheet, independent from the platforms themselves. This gives us the freedom to evaluate and compare data across platforms.
Assessment practice at-a-glance:
- Weekly updating of metrics spreadsheet
- Monthly tracking of followers on each platform
- Twice yearly thorough review of each platform and evaluation of what is working well and what is not
While tracking varies by platform, here are samples of what goes into our spreadsheet:
- Likes
- Shares
- Engagement rate
- Comments
- Reach
- Content type
So, what are some changes we made and improvements we have learned from our analytics insights? We learned that Facebook is for storytelling. That means posts about university and library news, as well as event updates after an event are what our audience wants.
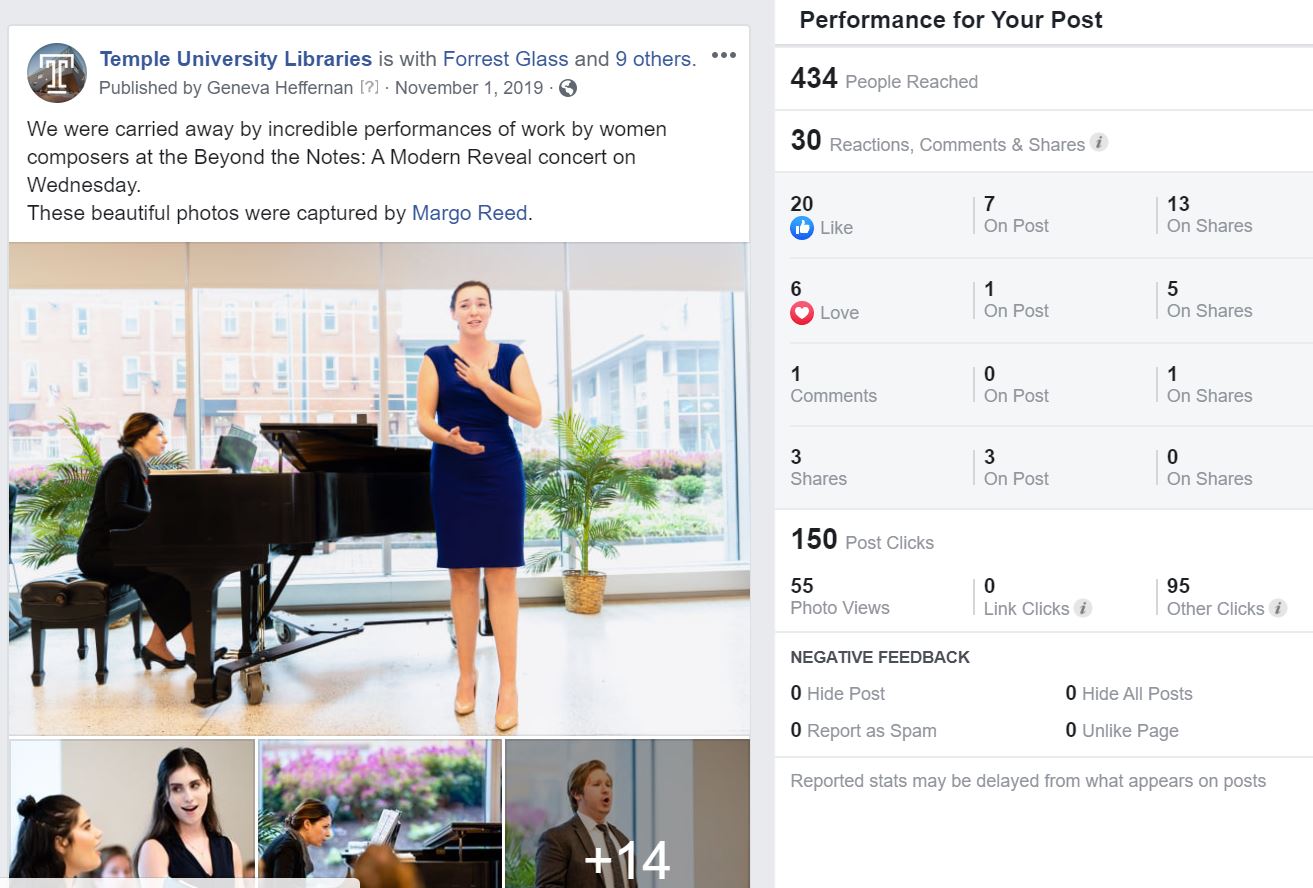
Facebook Insights Example 1
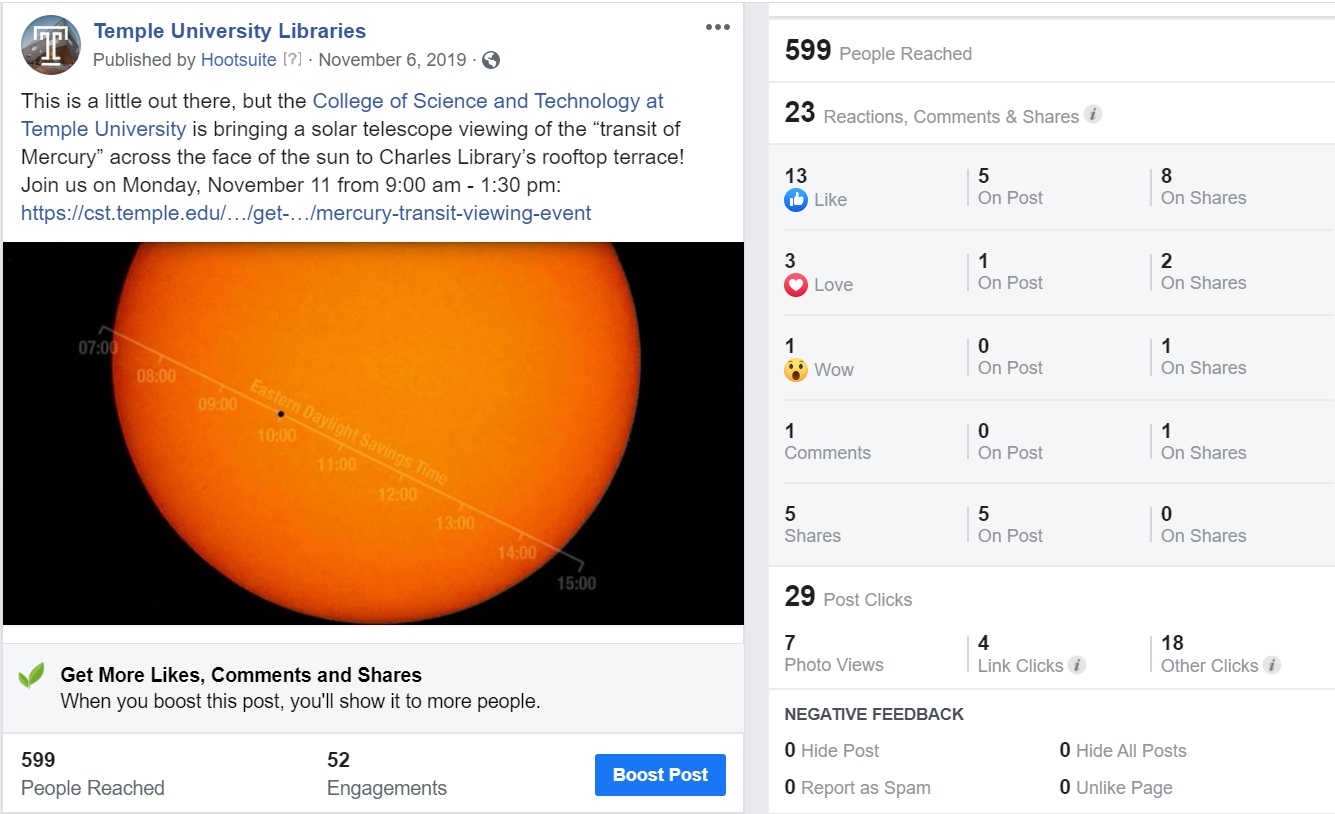
Facebook Insights Example 2
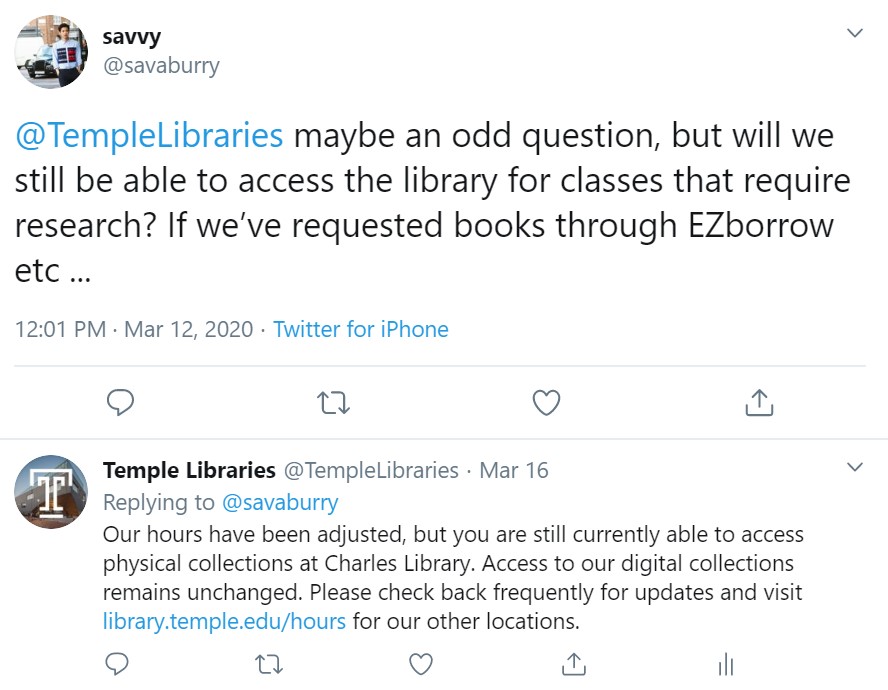
Twitter is a platform for news and conversation. It is where announcements are made and questions are asked. We have learned to go to Twitter first to spread pithy, important information, such as the closing of all our physical locations. It is also a place where followers can ask questions of us and know they will get accurate responses.
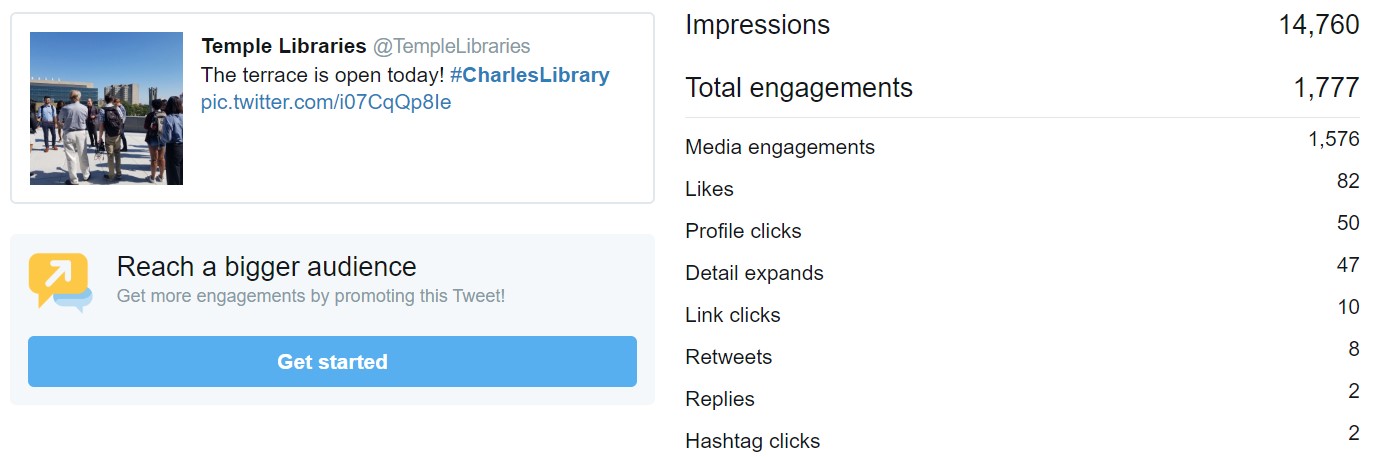
Twitter Post Example 1

Twitter Post Example 2
Twitter Post Example 3
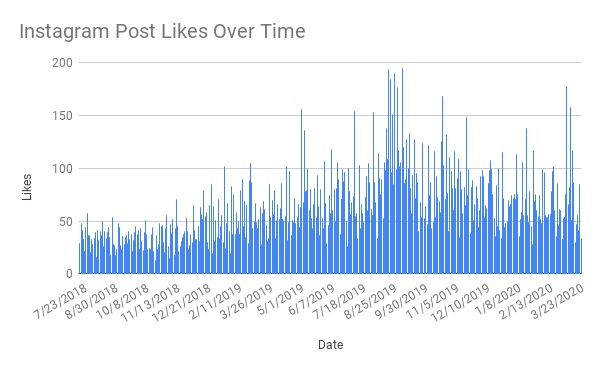
We’ve learned that on Instagram people want pretty pictures. It is a visual platform and people engage with a post only when they are drawn in by the visual. Because of this, we have been emphasizing photos taken by the university photographers or user-generated content that we are tagged in that are already strong photos.

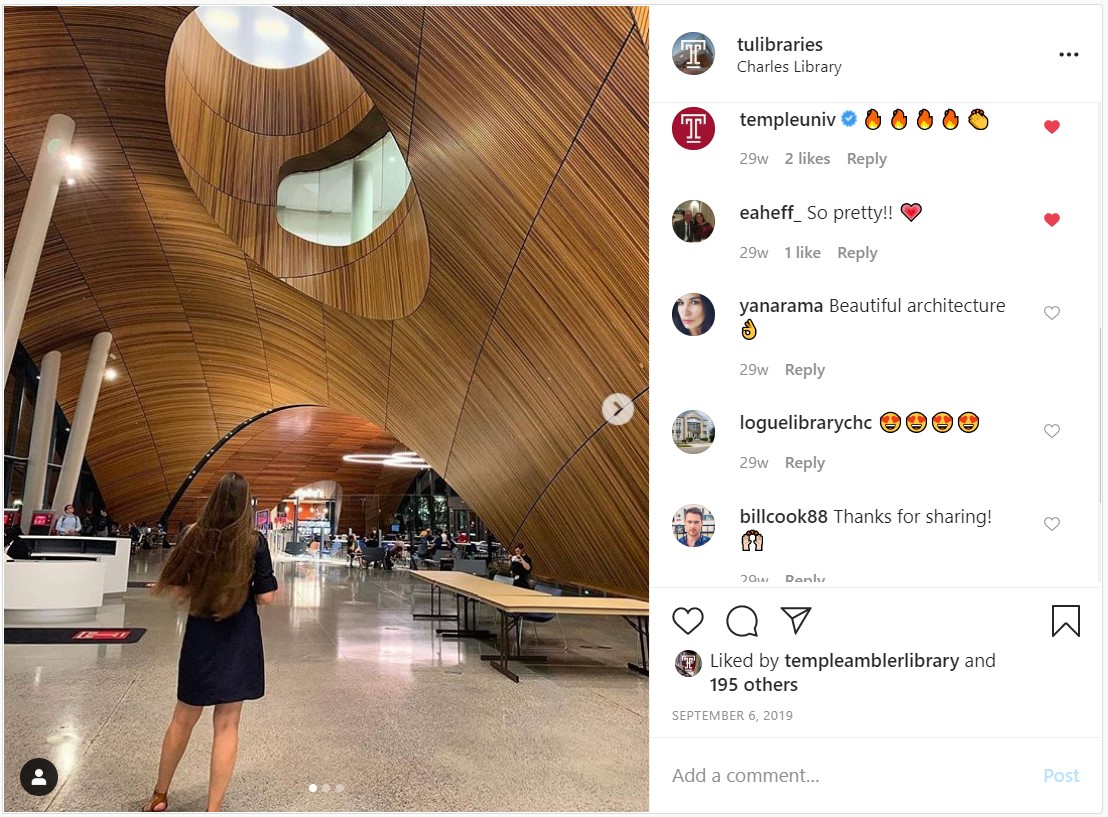
Instagram Post Example 2
Most of all, social media metrics tracking is a form of feedback about the Libraries as a whole. When we evaluate our interactions with our community on social media, we learn about what they need from us and what they like about our work. The metrics reflect interest in the Libraries. People using our resources are more likely to engage with our social media presence. As our number of users grow, so do our followers. As buzz grew around the opening of Charles Library, engagement with our content reflected that buzz. We work hard to show off the great work being done by our staff and the great work brings more attention to our channels of communication. There is always room for improvement, and we will keep striving for it.