We All Make Mistakes

Last week I learned a lesson about making mistakes, and it was both humbling and helpful. Just one day before the deadline for locking the University’s numbers into the IPEDS system (Statistics for the U.S. Dept of Education) for FY18-19, I was contacted by the University’s director of data analysis and reporting. “Where are the libraries’ numbers? “After a brief email exchange, password in hand, I was quickly able to input those numbers – prepared months ago for other purposes – ARL, ACRL, AASHL.

Annoying, each agency asks for data sliced and diced in different ways. Sometimes we separate out physical and digital titles, sometimes we separate articles and books in reporting interlibrary loan transactions. Reference can be most complicated, with data coming from multiple systems and channels (SMS, Chat, Analytics. LibAnswers), Excel spreadsheets, manual reports). 

But I felt confident in my IPEDS numbers, and the data input was easily completed. I reported back to Institutional Research and Assessment, and pointed them to the required backup documentation – multiple spreadsheets, reports from Alma, Read-Me files. From year to year,  if numbers seem out of line with previous years’ reports, those anomalies need explanation. For instance, I noted that physical circulation  declined due to the closing of Paley library. All good.  Next step, the data is AGAIN verified by the University Data Verification Unit. DVU provides another thorough audit, also requiring documentation to back up each number.

At 4:45 the day the numbers are due, DVU discovers an error. In calculating the total monographic expenditures for Law, HSL and Main libraries, I double counted two figures. I felt stupid, of course. But the error was easily fixed, verified by the Unit, and at 5:07 pm, the University’s data was locked. Yeh!

A long story, but I learned a couple of things. While the University-mandated data verification process is sometimes annoying, especially when time is tight, there is real value in having an external reader to double-check formulas, data input, and logic. No one is perfect. Internally here in the libraries,  I’ve begun the practice of my own verification – so I will double-check numbers provided to me. I want to understand so I can explain to others. 

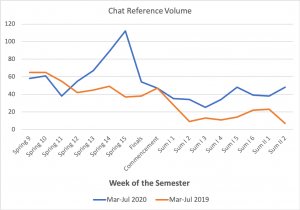
It is equally important for those “on the ground” to help me understand the numbers.  Why did circulation go down? Why did interlibrary loan go up? What happened on March 19 that caused our gate count to plummet? What was the impact of making our  webchat more visible? 

When we ask for documentation, it is not to be mistrustful or to create extra work. It ensures that the data we report for surveys, to accrediting bodies, for funding agencies and to our professional associations  is as accurate and reliable as we can make it. 

I don’t believe that mistakes are a good thing. But I learn more from my mistakes than pretending I don’t make them. I’m much better off when I am willing to ask for help, allow time for others to check my work, and consider the perspectives (and expertise) of my colleagues. And next time, maybe I’ll remember to keep my thumb off the camera lens. 

Posted in statistics | Tagged , | 2 Comments

Using Social Media to Engage Library Users

Today’s very special post is authored by Kaitlyn Semborski and Geneva Heffernan, from Library Outreach and Communications at Temple Libraries. 

At Temple Libraries, we use social media to build and maintain relationships with library stakeholders. Daily, our Instagram, Twitter, and Facebook platforms allow us to engage with students, faculty, staff, and community members through posts, replies, comments, and more. As we grow our audience, it is increasingly important to regularly track and evaluate our strategies and interactions on each platform to best serve them. 

We learn a great deal from tracking social metrics. First, we gain insight into our audience. Who are they? What do they like? What content do they interact with the most? What questions do they have for us? When are they online? Knowing our audience directly informs the type of content we create and share. The things faculty seek on social media often differ from the things undergraduate students seek. We work to cater to those disparate interests. 

There are some topics that span across audiences. For example, the number one shared interest of our followers on Twitter is dogs. This tells us that posting about National Love Your Pet Day or National Puppy Day will likely go over well with our followers (and they both did). 

Given our segmented audience, we commit to having some content for each subgroup, rather than having all our content interest everyone. For example, posts promoting specialized workshops tend not to perform the best in terms of engagement. This may be because the majority of our followers do not fit into the small niche of that particular subject (for example most might not know what PubMed, Gephi, or QGIS are) and are therefore less likely to engage with our post promoting it. Does this mean we should stop promoting the variety of workshops offered through the Libraries? We think not. The metrics show us that the audience segment interested in those posts is smaller, but we still value promoting our opportunities to all the Libraries’ patrons. 

It is important to note that our sole goal for social media is not to get the most “likes.” If that were the case, we would only post photos of puppies reading books all day. While we like to increase engagement on our social platforms, our ultimate goal is to use social media to increase engagement with our online and in-person services across our libraries. Social media is one of the most direct ways we have to engage with our users online, and we want to inform them about what the Libraries are doing to serve them. 

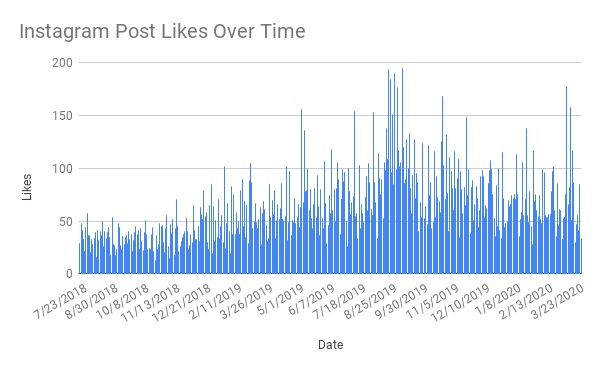
Each social media platform we use (Twitter, Facebook, and Instagram) provides native analytics and each scheduling platform we use (Later and Hootsuite) has its own metrics collection. In order to stay consistent with what we track, we collect our metrics in a spreadsheet, independent from the platforms themselves. This gives us the freedom to evaluate and compare data across platforms.  

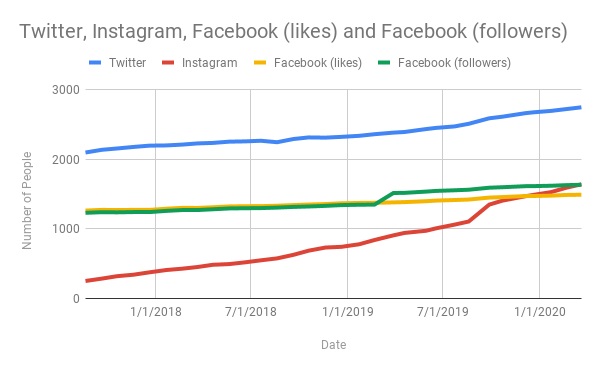
Likes and followers by platform

Assessment practice at-a-glance:

  • Weekly updating of metrics spreadsheet
  • Monthly tracking of followers on each platform
  • Twice yearly thorough review of each platform and evaluation of what is working well and what is not

While tracking varies by platform, here are samples of what goes into our spreadsheet:

  • Likes
  • Shares
  • Engagement rate
  • Comments
  • Reach
  • Content type

Instagram posts over time

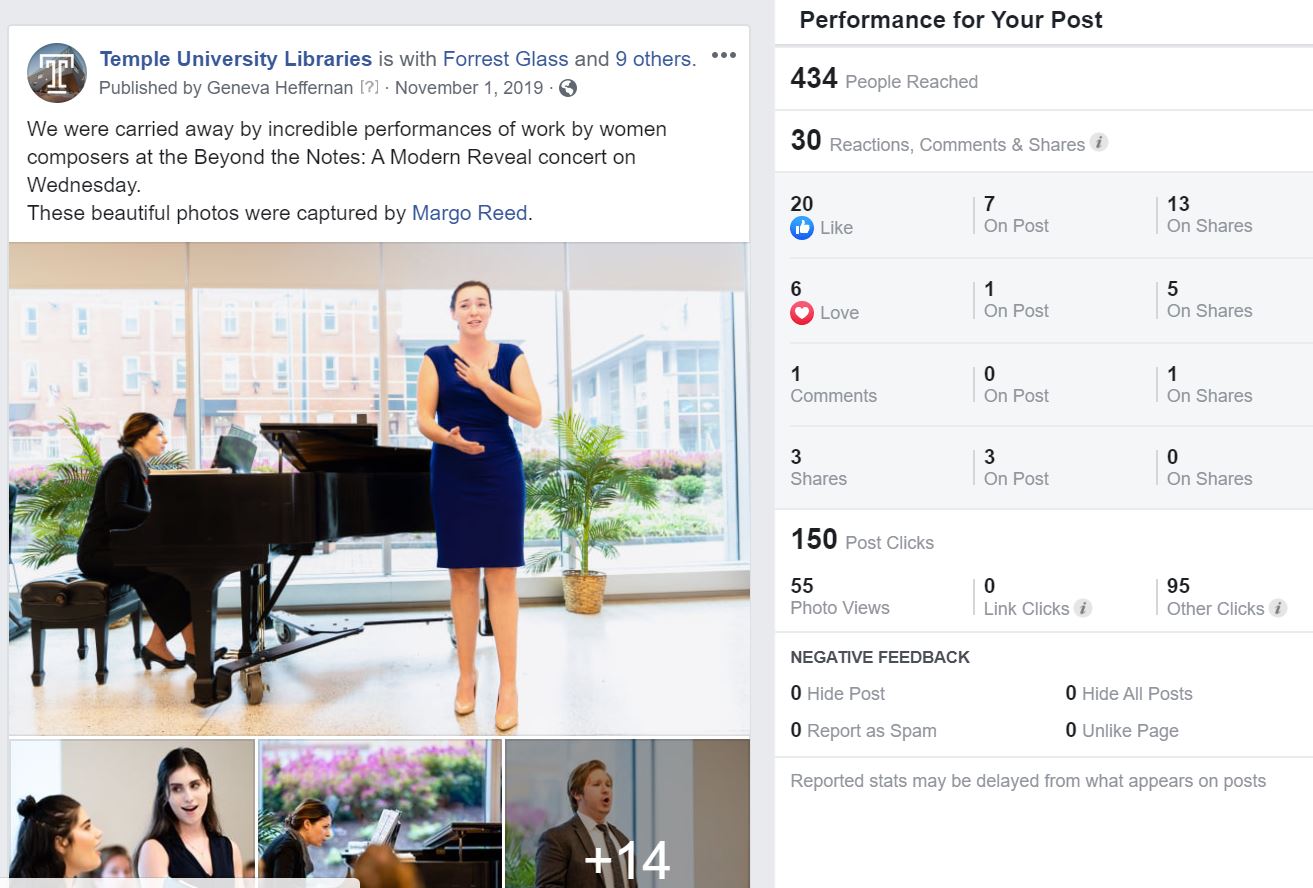
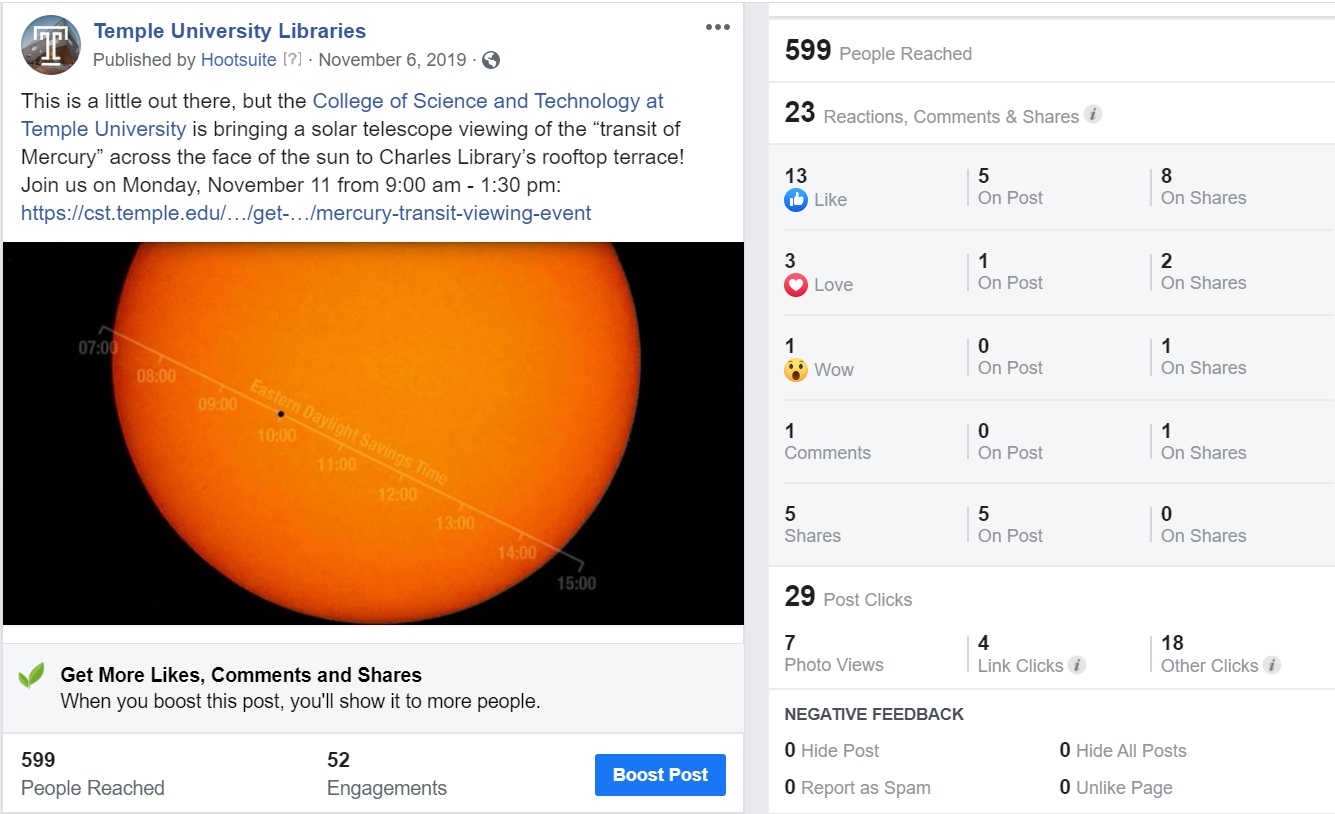
So, what are some changes we made and improvements we have learned from our analytics insights? We learned that Facebook is for storytelling. That means posts about university and library news, as well as event updates after an event are what our audience wants.

Facebook Insights

Facebook Insights Example 1

Facebook insights

Facebook Insights Example 2


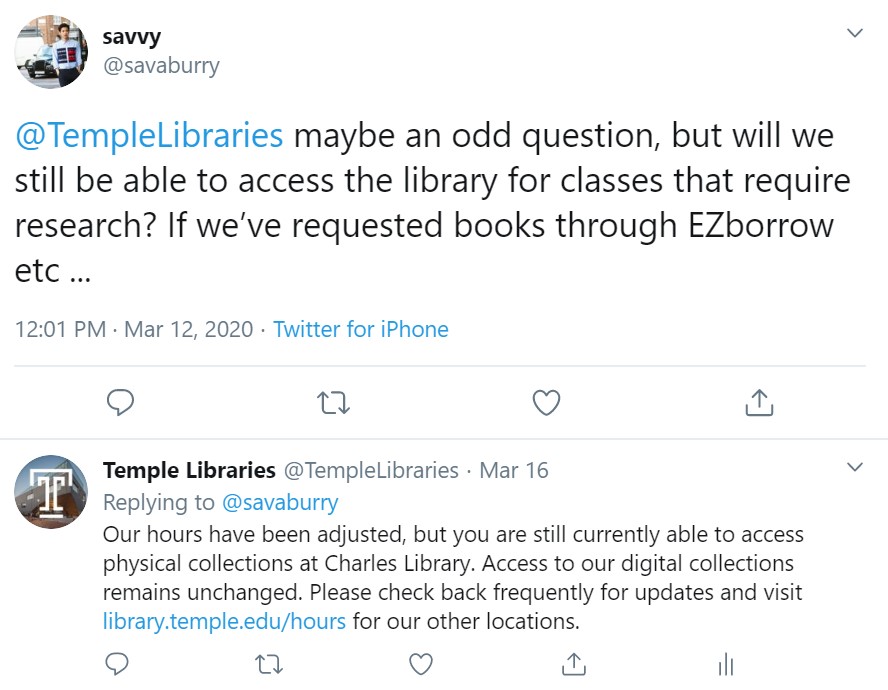
Twitter is a platform for news and conversation. It is where announcements are made and questions are asked. We have learned to go to Twitter first to spread pithy, important information, such as the closing of all our physical locations. It is also a place where followers can ask questions of us and know they will get accurate responses. 

Twitter Post Example 1

Twitter Post Example 2

Twitter Post Example 3


We’ve learned that on Instagram people want pretty pictures. It is a visual platform and people engage with a post only when they are drawn in by the visual. Because of this, we have been emphasizing photos taken by the university photographers or user-generated content that we are tagged in that are already strong photos. 

Instagram Post Example 2

Most of all, social media metrics tracking is a form of feedback about the Libraries as a whole. When we evaluate our interactions with our community on social media, we learn about what they need from us and what they like about our work. The metrics reflect interest in the Libraries. People using our resources are more likely to engage with our social media presence. As our number of users grow, so do our followers. As buzz grew around the opening of Charles Library, engagement with our content reflected that buzz. We work hard to show off the great work being done by our staff and the great work brings more attention to our channels of communication. There is always room for improvement, and we will keep striving for it.

Posted in data-driven decision making, statistics, web analytics | Tagged , | Leave a comment

A New Day for Assessment Practice?

sunrise from airplane

It is difficult to believe that in early March we convened the Assessment Community of Practice, joining Margery Sly and Matt Shoemaker to talk about changing needs for assessment measures as we develop new library services. The new Charles Library affords us the opportunity to offer more facilities, technologies, and expertise.  We talked about how best to assess the impact of those new types of spaces on our community.  We agreed that by necessity, much of our “assessment” is counting: the numbers of visitors to the reading room, attendance at instruction and workshops, use of physical collections, use of computers and specialized software in the Scholars Studio. 

We talked about the differences in academic departments who had more or less interest in our offerings. Some faculty take advantage of special collections and the instruction offered on use of primary resources. Others find value in new types of research questions and collaborations made possible through the Scholars Studio.

In just three weeks, this important discussion seems less relevant. The questions continue to be useful – how best to gauge the usefulness and long-term impact of our services on the students, faculty and community we support?  But even the most basic of measurements: the gate counts, the use of physical materials, the attendance at in-person workshops and instruction sessions – these are no longer available to us.   There are no physical bodies to count. There are no hands-on workshops to evaluate. 

This is a loss, of course. (I hate to think how our library trend-trackers like the Association of Research Libraries will accommodate this year’s statistical anomaly.) But for Temple, it provides an opportunity to explore our questions in new ways, with new tools. We are impelled to think about how to mine our web analytics data more deeply. We continue to have access to data related to the use of the website, our discovery systems, our licensed resources and the many channels of social media output from the library. Springshare and Ezproxy provide us with tools on the use of library-curated content and collections.

Demonstrating the use of our expertise in providing access, research and instruction support takes a very different shape now. It also provides us with a testing ground for many of the initiatives that are already underway. Instructors of English 802 will be in a much better position to help us improve our online version of that library workshop.  The Health Sciences Libraries quickly transitioned to Zoom versions of their popular workshops – perhaps making these even more accessible to busy students and faculty.  Jackie Sipes is exploring ways of doing remote usability testing of Library Search and other online discovery tools. 

Just a week ago the libraries had a physical space to which students, faculty and community could come. We were solid. Our buildings and physical spaces staffed with humans had a presence that signified the essential place of the Library on the campus. Now that place may not be as obvious to our users.  At least for the near term, we will need to re-imagine how the library positions itself and how we demonstrate that continued impact and value to our community. 

Posted in library spaces, statistics, web analytics | Tagged , | Leave a comment

When a Marker is More than a Marker 

Picture Credit: Zombeiete from Flickr Creative Commons

User experience is all around us. In libraries, we often think the assessment of user experience relates to web interfaces, or building way finding and navigation. We might, ask, “Is the language that we use on the website clear to non-librarians?”  “When visitors come into the library, are they provided sufficient affordances  for orientation to the services and spaces available? “

Of course these are questions we already have on our plate for exploration, particularly now as we deal with issues of user experience in a very new library building, the Charles. 

But dry erase board markers? That seems like a pretty small operational decision. We either make them available for check out, or we don’t. But when the option of providing markers to students arose, it got a bit more complicated, and everyone had an opinion.  

Charles Library has 36 study rooms each equipped with whiteboards. These are quite popular, as evidenced by the sprawling, specialized, and creative work we see in the rooms. It is gratifying to see how this simple tool sparks collaboration among students.  Exactly the behaviors we hoped to see in these new library spaces. 

In providing study rooms, there are operational decisions to be made, from how we manage room reservations to policies on use of the rooms.   When the rooms opened, the issue of markers was raised. Should we provide them? And how? Multiple options were discussed, and each might be evaluated on a kind of user experience. 

MOST SEAMLESS EXPERIENCE

Make markers always available in study rooms

Make markers freely available at the service desk, but don’t check them out

Check out markers at service desk

Make markers available for purchase in vending machine

Make students responsible for bringing markers for use in study rooms

LESS SEAMLESS EXPERIENCE

There may be other solutions, of course. It’s clear that there is a range of options, and each has implications for the user experience. Each option needs to be balanced against library operational concerns, including staff time and effort (creating records in catalog for checkout, preparing the material for checkout, time for transaction at checkout, collecting fines for lost markers) and of course, the outright cost of the markers.  

We may decide that while students might love to have each each study room supplied with an array of colored markers, all full of ink, each time they visit – that may not be the experience we can afford to provide, given other organizational priorities and expectations.

Fortunately, students seem happy to bring their own markers,  as we see many wonderful expressions of collaborative work in the study rooms. While there is no right or wrong answer as to providing markers,  it’s always useful to remind ourselves that 1) there is a range of solutions available to us and 2) the solution we choose may impact user experience.  

Posted in library spaces, usability, user experience | Tagged , | Leave a comment

Are There Any Meetings on Library Assessment?

Assessment is a growing topic of interest at American Library Association meetings and last weekend I had the privilege of participating in several meetings to discuss trends and challenges. 

Look at How Far We’ve Come: Successes

Assessment practice is evolving from the solo librarian to the assessment conducted in multiple domains – user experience, collections analysis, space design. We started the ACRL Assessment Discussion with a sharing of successes. Grace YoungJoo Jeon at Tulane demonstrates that one librarian can accomplish alot. In her first year as Assessment and User Experience Librarian, she talked with everyone about assessment, learned about their needs, created a list of potential activities, and began to prioritize the work ahead. Grace described reaching out to other units on campus, including the Office of International Students and Strategic Summer Programs. She worked with them to design and moderate focus groups with international students.   All in one year!  

Penn State Libraries’  success this year is a growing department for assessment and metrics headed up by Steve Borelli.  Prioritizing assessment needs through the lens of budgetary operations, they are currently advocating for a position in collections assessment for a department of four. 

Joe Zucca at the University of Pennsylvania  is using the Resources Sharing Assessment Tool (Metridoc) as a space for collecting interlibrary loan statistics, enhanced with MARC data from the consortium’s individual library holdings. With connections to Tableau, data visualization enhances the ability to evaluate inventory and use, and provides potential for collection development at a collaborative level. 

We Still Have Some Challenges

In the example of RSAT, merging data from 13 institutions creates some challenges. There is a “near total absence” of data governance, including some 600 designations for academic departments. This lack of standardization makes cross-institutional analysis very difficult to do. 

Of course this isn’t just a problem for large-scale analysis across libraries. One assessment librarian discovered her public services departments have a “home grown” system for tracking reference and directional questions. While standard definitions provided by ACRL and ARL can provide some guidance, libraries may not want to be limited to these, more traditional, metrics alone. There is a spectrum of opinions as to how to count, what to count. How best to define a transaction? 

This lack of agreement related to counting has ramifications down the line, particularly if these metrics are used in performance review. What is to prevent someone from “bumping up” her numbers?  We talked quite a bit about how the library “reduced to bean counting” is no way to tell our story. Librarians may very well feel that a focus on counting diminishes the work that they do. 

The Rearview Mirror

We shared concern that assessment practice is “always looking through the rear view mirror”. When we look at trends only at annual review time, we fail to understand those trends to plan for the future.  We may prefer to ignore the trends.  We tend to keep our data silo’ed, making it difficult to see the full picture, or inter-relationships.  A great example is this one: Less questions about finding Huckleberry Finn (a decrease in numbers at the reference desk) could mean that our discovery systems are working even better.  Fewer page views on our website may result from a more efficient, user-friendly interface. We need to look at our numbers in a more integrated way. 

It was good to talk about our challenges, our successes, and best practices with a group of understanding peers. Then on to the next meeting, LLAMA Assessment Community of Practice, Hot Topics!

Posted in uncategorized | Tagged , | Leave a comment

Furniture feedback in Charles Library

When we opened Charles Library in August of 2019, we knew right away that we needed to increase the seating capacity in the building. During the day, a walk through the upper floors of the building gives the impression that we are at, or quickly approaching, full capacity.

The first physical space UX project I did in Charles was to gather data about the current furniture. In the fall, I worked with Rachel Cox, Nancy Turner, and Evan Weinstein to collect data on furniture use and preferences. We’re using that data now to recommend additional furniture and space improvements.

Methods

To kick things off, Rachel and I conducted floor-by-floor walkthroughs, counting the number of seats occupied and recording observations about furniture use. We carried out the daily walkthroughs for one full week in October. We entered the headcounts and observation notes on a worksheet. The student building supervisors handled data collection at night and on the weekend.

Worksheet for recording observational data

The sweeps gave us a sense of how full the building was at different hours and how students were using the space. But, we also wanted to know if students liked the new furniture.

To find out more about this, Rachel and I built a survey that asked what students came to the library for, if the furniture met their needs, and what they liked and disliked about it.

survey p. 1

We got 213 responses. Rachel and I analyzed over 600 survey comments over a couple of days, sorting the comments into categories.

Survey analysis

Findings

The majority of students (78.4%) came to the library to study alone but studying as a group was also very common (48%). Other reasons to visit included resting between classes, finding a book, going to the cafe, visiting the Scholars Studio, Graduate Study Area, Special Collections, or Student Success Center, and hanging out with friends. 54% responded that the furniture didn’t meet their needs.

The over 600 survey comments provided us with more detailed information about what students wanted:

  • More seating generally
  • Comfortable seating  and “cozy” spaces
  • More spaces to support individual study
  • An environment mostly free of distraction that also allowed some level of chatting/interacting with others

More seating

The headcounts revealed, somewhat surprisingly, that we rarely reached over 50% occupancy on any floor of the building, even during the day when the building looks full. Survey comments told us that students sometimes cannot find a seat in the library, and a few asked specifically for more seats. Students also described the existing seating as being “too close” to other students and too small for spreading out their work. Lack of personal space at the large open tables was a common thread throughout the survey comments.

Privacy

Right now, the open study areas in Charles Library are furnished mostly with open seating tables. This is a dramatic shift from Paley Library where students were accustomed to semi-private, partitioned desks and armchairs with individual side desks. Students miss the private seating they found in Paley; one commented,

“Please, provide some cubicles or private study spaces. It takes so much time to book a study room because they’re rarely available. The cubicles that used to be in Paley fit my needs well and I have not been nearly as productive since moving to Charles.”

Others spoke directly about distractions, both noise and visual, at the open table seating,

“…perhaps these spaces could be furnished with … divided desks to remove distraction from the (sometimes embarrassingly noisy) library environment and to center focus on the work I came here to do…”

Comfort

Another common theme was the desire for comfortable seating. Students frequently asked that we add “comfortable” furniture and make the space cozier. “Comfortable” and “cozy” were used to describe soft seating like beanbags and couches, as well as upright tables and chairs. The comments overall conveyed a strong preference for furniture that supports work, and in many cases, “comfort” meant seating that is ergonomically designed for sitting and doing work over extended periods,

“[I want] couches and seating like you would find at a cozy coffee shop. The furniture I have used has been very uncomfortable and I cannot do work for a long period of time without something in body aching. The library is absolutely gorgeous, but the furniture is probably the biggest complaint…”

Even our lounge furniture doesn’t meet students’ expectations for comfort. They described the lounge chairs and small polygon tables as too “low to the ground” and lacking “function.” One student demonstrated their distaste for the lounge furniture with a drawing of a stick figure hunched uncomfortably in one of our lounge seats to reach a laptop on the small polygon table. Others asked for armchairs and other soft seating,

“I don’t really feel that there are any comfortable arm-chair like seats at the library like there were at Paley. I can’t get comfortable anywhere, and as a result, I don’t feel welcome to stay long…”

During the building walkthroughs, we mostly saw students using the lounge seating to do work, rather than for socializing or other short term activities more suitable to lounge seating. But, the lack of a work surface at those seats meant that students either hunched over the small tables or created work surfaces using benches, laps, window ledges, or a second lounge chair. The survey made it clear that students do not like the lounge seating because it’s not ergonomically suited for doing work.

Conclusions

Despite increases in group and collaborative work, student space needs are still strongly tied to individual study. The survey showed that students primarily come to the library to study alone and they want to do that in a comfortable environment that is relatively free of distraction.

The survey provides us the evidence for prioritizing future purchases of furniture, including pods or carrels for individual study. But we’re also exploring ways of re-configuring our current furniture to provide semi-private spaces with minimal distractions. Table partitions and different furniture arrangements can create barriers, providing students with a psychological sense of privacy.

tables around ledge with students studying

Extra seating for exam period

When we added the individual table seating around the ledge during exams, it was immediately popular. Though these seats are in high-traffic areas, they allow students to face away from others, providing a buffer from visual distractions.

We also want to get a better understanding of study room use and continue to gather student input as we select potential new furniture.

Posted in library spaces, service assessment, surveys | 1 Comment

We Don’t Want to Work with Mummies

At Charles Library we are experiencing a more open office environment. I saw an  extreme version at the Penn Museum this weekend ; the conservator’s workspace is actually in the gallery, on view several hours a day. But the office mate, a mummy, is very, very quiet.

These issues of privacy, of noise, and of how we move around our space without disturbing co-workers, surfaced in several workplace norms conversations that I conducted in September. The meetings, organized by work area, were designed to surface issues of concern about the kinds of environment (and behaviors) that would enhance, and detract, from the “ideal” working conditions. Would it be a problem to eat tuna salad at one’s desk? How can we signal to colleagues that we are not “interruptable”?

Some anxiety about establishing workplace norms emerged when we talked one-on-one with staff as part of the Envisioning our Future project. Even before the move, staff were concerned about the more open workplace environment and the need to set guidelines for behaviors. Recognizing as well that multiple types of work would be taking place in our new work spaces. Would this lead to more collaboration in person because of casual interactions,  or just more use of electronic communication?

The discussions were summarized and shared with all of the staff in that workspace, including those who were not at the in-person conversations. A summary email was sent to all staff.

Did the workplace norms conversations make a difference?  Last week I launched a short survey to staff to gauge the effectiveness of the process. It’s never easy to ask for feedback, risking the possibility that it did not make a difference at all, or worse, it was considered a waste of time. While that didn’t happen, I did learn some lessons, about the process and about assessment.

About 40 staff members participated in the five sessions. 15 of those people responded to the survey. They were from all work areas, 

  • 66.7%  participated in the session
  • 86.7% read the document resulting from the session
  • 66.7% read the email to staff

I asked three additional questions:

From your perspective, what degree of change has occurred in attending to workplace norms in your area? (0 is “none at all” and 5 “a good bit”)

From your perspective, what degree of change has occurred in attending to workplace norms in your area based on issues discussed in the facilitated conversations/shared documents? (0 is “none at all” and 5 “a good bit”)


Although this is a very small sample, it seems that time in our new spaces has had more of an impact than the actual conversations. (I base this on the fact that the average goes down for the second question).  The comments provide a bit more insight into this interpretation:

The process elicited quite a bit of variation between work areas in some aspects of the work environment, like tolerance for noise. Some were disappointed that the outcome did not result in concrete decisions about policy. Others felt that the conversations led to more comfort in discussing the workplace norms.  But they were not the real impetus for changes in developing norms that staff are perceiving.  Those arise from just just being together. And there are outstanding areas of negotiation, like the use of the breakout rooms. 

What did I learn as a facilitator? That I can be challenged by remaining neutral in these situations.  I need to follow my own ground rules in providing equal voice to all participants.

But overall, I feel positive about:

  • providing an opportunity for staff to get together and
  • opening up a dialogue that may  not have come about as readily without these meetings

Mainly, I am appreciative of my colleagues who participated in this effort. We don’t necessarily want mummies as our work mates, but it’d be nice to play our music as loud as we like.  

Posted in organization culture and assessment, process improvement | Tagged , , | Leave a comment

Celebrating 10 Years at Ginsburg: A Time for Review

The Ginsburg Health Sciences Library is celebrating its 10th birthday and used the occasion to conduct an intensive review of current operations and planning for the future. Barbara Kuchan, Director of the Health Sciences Libraries, worked with a team (Patrick Lyons, Jenny Pierce, Natalie Tagge and Will Dean) to plan the process. Since the review included a hefty mix of assessment activities, I was invited to participate as well.  

In addition to looking at 10 years of activity statistics, the group decided on three assessment methods: focus groups, a whiteboard for user feedback, and space usage analysis with heat mapping.

Five focus groups were conducted with students, with faculty, and with staff. I asked them about how the library’s spaces, technologies and services support their work. What works well? What are the challenges? If you could wave a magic wand, what would your ideal library be like?

“Magic wand” questions can be a good way of getting at library qualities that are important to users. For instance, students described their dream library as high tech, but with “green” attributes – trees, a courtyard, and natural light. It has lots of bathrooms. It has secluded areas (nooks and crannies) but also an open feel. The temperature is not too cold or too hot. Having a Starbucks in the library would also be nice. 

We gathered additional feedback in a very simple way: a large whiteboard was placed in the library’s lobby.  Library staff queried in-person visitors about their use of the library, impressions of short-comings and strengths, and topics of general interest. This approach is lightweight (i.e. easily and cheaply done) and provides an opportunity for anonymous feedback.

Will Dean led an analysis of space usage, conducting regular audits of seating to determine the most popular areas for library work – a heat mapping exercise. Using the library’s floor plans, staff divided the library space into a series of zones. The staff then counted the number of individuals in those zones at various times of the day, during busy and quiet times of the year. A heat map of the data with the “hot spots” in red and not-so-hot spots in “blue” gives us a visual display of how popular certain areas are, and identifies not-so-popular areas.

In this example from the lower level, the tables by the windows (Zone 2) are popular, as expected for the natural light provided there. Unexpectedly, the carrels near  the stacks (Zone 7) are about as popular, appealing to those requiring more secluded, private spaces for study.


What is most exciting about the report is not just the richness of the data collected, and the wide-sharing of the findings (at an all staff meeting and via email), but the many recommendations for changes to spaces and services that came about based on the assessments.

For instance, student needs for quiet space and interest in stress-reduction may result in a redesigned room as a “green study lounge.”

Staff interviews led to a recommendation for improved on-site IT support. This would allow Ginsburg to meet user requests in new ways, like the live streaming of  workshops.

Assessing for the future is hard. How do you ask users what their future needs will be?  How do you determine the best direction to take when users may not know what services the library can provide? The team addresses this dilemma in its conclusion: 

 Taking the time to assess current needs and plan for evolving ones is a worthwhile investment. Now that a health sciences library assessment team has been established, evaluation of programs and services will become part of continuing operations. For this benchmark assessment, work now focuses on prioritizing and implementing key recommendations.

For more information about the project, contact Barbara Kuchan at b.kuchan@temple.edu


Posted in assessment methods, data-driven decision making, library spaces, qualitative research | Tagged , , | Comments Off on Celebrating 10 Years at Ginsburg: A Time for Review

Stretching Boundaries, Crossing Thresholds


Today I needed a metaphor to suit my photograph.  It’s the immersive artwork Flight Paths by Steve Waldeck installed at Atlanta’s airport, constructed of thousands of laser cut “leaves” and incorporating sounds and images of birds. The artwork makes walking the terminals a memorable experience.  

I was returning from the Designing Libraries conference and considering how the recent move to Charles, this very different physical space, impels us to think differently about our work and the organization. How do buildings shape our organization? How will Charles stretch us? 

The session on Using Innovative Ideas and Team Building to Drive Organizational Change addressed these questions. Mary Ann Mavrinac (University of Rochester) talked about how collaboration drives organizational change.  She compared organizational structures to rubber bands – we can stretch them, but they will tend to go back to hierarchy as a default. So we must continue to stretch and build teams for collaboration.  

Charles is stretching our organizational muscles in more than the exercise we get on the stairs. The more open spaces, for both public and for staff, test the “territorial” boundaries that our administrative structures can create.  Here are some examples, 

Just before DL, I facilitated a series of  workplace “norms” conversations with staff from work areas at Charles. This process was not about setting new policies. It was about talking together, in groups that mixed departments to surface what an ideal work environment was like and what challenges that ideal. We generated ideas for enhancing the positives in our work environments, from setting aside space for sharing food, to a desire for space that was not so silent as to feel monastic. 

So the move to Charles provided an opportunity to engage us in a process that is:  

  • Non-hierarchical
  • Participatory
  • Where all have equal voice and
  • Department agnostic

But the norms process also brings to light the different ways in which we conduct our work with colleagues and patrons. Limited resources for space requires us to work together in resolving conflicts and coming up with creative solutions. 

The openness of the building is forcing issues as well. Many of our services and special spaces, like the Loretta Duckworth Scholars Studio,  are more visible.   As students are actively looking for seats and computer workstations, this accessibility needs to be balanced with use policies that meet their needs. These needs may require more “permeable” boundaries for usage. 

The One Stop Assistance desk and consultation spaces nearby necessitate a rethinking of boundaries as well.  In a small space, we are providing IT services, reference services, access consultations and circulation, as well as managing a busy self-service holds shelf. We process guest computing applications, handle media equipment and train faculty in course reserves. To provide these services seamlessly we must cultivate more permeable boundaries between departments, allowing us to share information, decision-making and resources in new ways. 

At last year’s Designing Libraries conference, Greg Rasche (North Carolina State) claimed that new buildings provide us with once in a lifetime opportunities. He said,  

Hunt was a meteorite opportunity. If you miss it, it will set you back. If you overdo it, you can always scale back, but if you miss that opportunity for change, you’ll never get there. Use failures and successes as a way of evolving your organization.

Our local experience brings this advice home,  as we learn how changes of services and space can propel organizational growth.  Let’s not be afraid to fail, and learn, as we cross those thresholds into new territory. 

Posted in conference reports, organization culture and assessment | Tagged , | Leave a comment

Envisioning our future: Will the view forward ever be clear?

This was a thrilling week at Temple University Libraries, as many of the staff moved into their new office spaces at Charles Library. The windows provide an abundance of natural light throughout the building – at last we have escaped our cinderblock bunker-like offices.  

This week also saw the distribution to staff of the self-study Envisioning the Future (see August 12 email to libstaff). It’s another way of shedding light, as the research team asked staff to anticipate how the new spaces will impact their work, particularly with users and with colleagues.  The research project was part of an ARL initiative for assessment, and their prompt question for our research was this one: (How) do library spaces facilitate innovative research, creative thinking and problem solving? 

We wanted to look at the question from the perspective of the staff.  If new library spaces facilitate innovation, staff must be supported in helping users to be innovative. What are the best practices for supporting staff as they help users in new ways? Here at the Charles, we will be introducing to campus a whole new way of accessing and discovering our collections, new ways of using technologies for research and instruction,  and new ways of providing services. The space is part of the infrastructure, of course, but the people will be what makes it all work. 

In the course of 29 interviews with staff at all levels of the organization, we asked,

  • “How do you anticipate your work with users changing?”
  • “What do you think the opportunities and challenges will be?”
  • “How might your work with colleagues change?”

We also asked about the ways in which we were preparing for the changes, and how we felt best supported in making those preparations.

What did we learn? At the time of the interviews, staff concerns centered most about the loss of private offices and the convenience for small meetings and consultations those provided. But they acknowledged that private offices can create isolation from colleagues, and a lack of visibility to students. The new spaces will provide far more opportunities for interacting with colleagues in informal settings. Another potential cost will be the shared spaces that are noisy and full of distractions. Yet for many staff members, these have always been part of their work environment. And they appreciate the collegiality and fun that can develop in these environments. 

Communication is key as staff prepare for changes. While most recognize that information may not be available, even at the highest levels, and is always subject to change, many cited the “Ask Me Anything” (AMA) sessions as one of the most useful approaches for sharing information with staff. The regular reminders (and incentives) for purging offices of paper were important as well.

In the months prior to the move, the anxiety level of many staff was pretty high. That needs to be acknowledged and allowed to be discussed in safe ways. But only a few staff took advantage of the change management workshops sponsored by peer groups, which was interesting.  Many staff also look forward to more conversations about norms in shared office spaces. Now that we are actually in the space, we’ll have more opportunity to know what those issues will be. 

A big thank you to the research team.  (Olivia Given Castello, Rachel Cox, Jessica Martin, Urooj Nizami, Jenny Pierce, Jackie Sipes, Caitlin Shanley, Stephanie Roth)Envisioning our Future is just the first step in a longer-term project to look at how staff work in the building.  Will the Charles Library shape our organizational culture? Will it inspire staff to be more creative and innovative, as it is designed to support those behaviors for our patrons? And how can we best engage staff in helping to shape that future?  This kind of qualitative research is time consuming and messy. But we come away with a much richer picture of the organization at this very exciting and unique point in the libraries’ development.  And perhaps, with a clearer view of the best way forward.  

Posted in organization culture and assessment | Tagged | Leave a comment