Using SQL to Manage Parcel Subdivisions

Managing a municipality’s parcel dataset can be a full-time job, depending on several factors including the size of the municipality and the nature of growth in that municipality. For example, an up-to-date parcel dataset will include the most recent information about several potentially regularly changing attributes, such as who owns the property, and what kind of taxes are owed by the owner. Not only is the attribution of the parcel dataset changing on a regular basis, but the geometry that represents the boundaries of each parcel can also change. One of the most common causes of a change in parcel geometry is a subdivision.

Take, for example, a parcel representing a large farm. If the farm is sold to a development company, it is unlikely that the purchasing company will retain the property as a single land entity. They are likely going to build several houses on the property, divide the property into plots for each home, and sell the plots one by one to new homeowners. Not only do new attribute records need to be kept for each new parcel, but new geometries need to be drawn and the original geometry needs to be modified to reflect its new boundary. Often times the leftover areas of the original parcel will represent common areas, such as parks, playgrounds, or streets.

Fortunately, if you are managing data in a desktop GIS environment, there are several tools at your disposal that will allow you to create new polygons and cut out their footprints from the original polygons. However, if your data is hosted in a spatial database, you may not have the tools at your disposal to do this. The following SQL script was written for this exact function, assuming that you already have the footprints of the subdivided parcels created, and you need to update the geometry of the original parcel to reflect the subdivisions that have been removed. The script discussed below was written for Microsoft SQL Server (T-SQL), however, the common principals can be applied to many other versions of SQL. Below is the full script, followed by a walkthrough of important steps in the code and what they do.

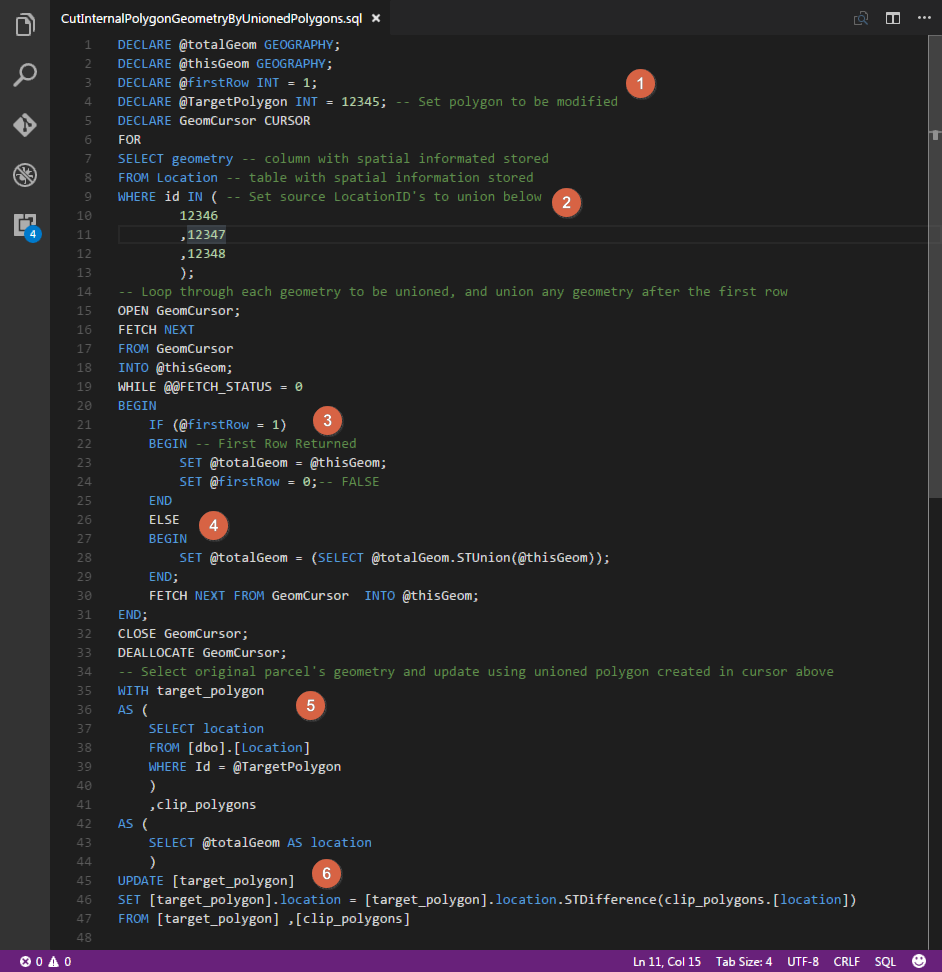
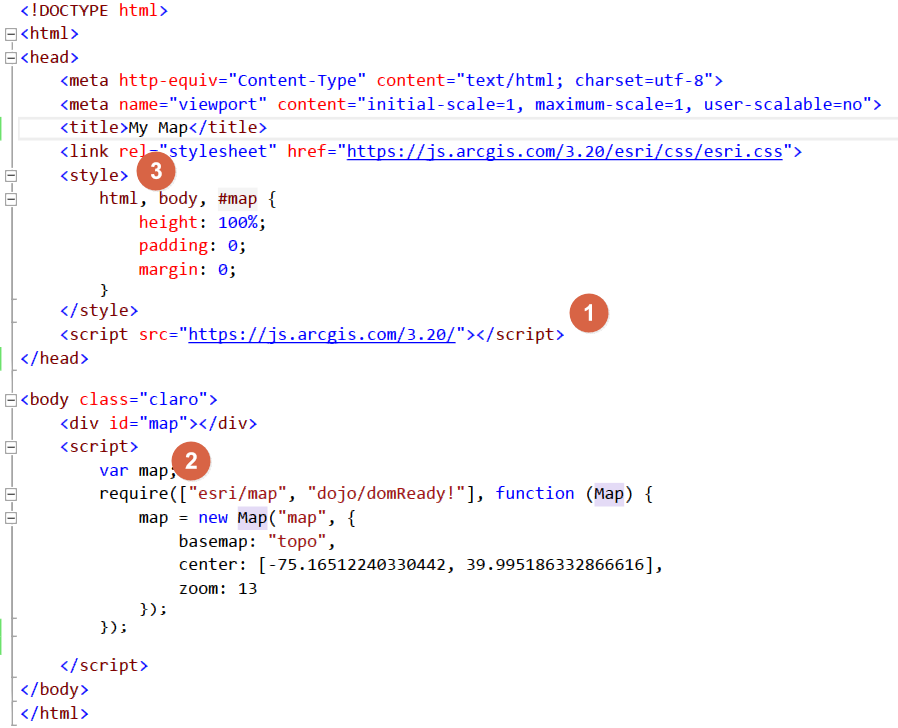
SQL script used to cut several polygon geometries out of a single, source polygon

The script does the following:

  1. Predefines the original parcel’s geometry record ID that you wish to modify.
  2. Select’s the spatial record based off of a list of ID’s provided (representing the geometries of new parcel created, to be clipped out of the original parcel) and passes those records into a cursor.
  3. Within the cursor, the geometry of the first record is selected.
  4. Next, all other geometries are unioned together.
  5. Once the cursor has completed unioning new parcel geometries, the original parcel’s location record is selected.
  6. Finally, the original parcel’s geometry is updated, using STDifference to remove the unioned parcels’ geometries from the original parcel’s geometry.

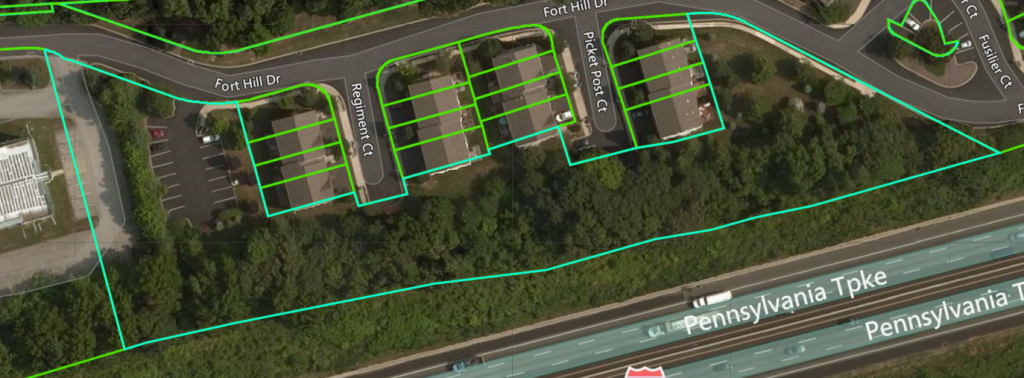
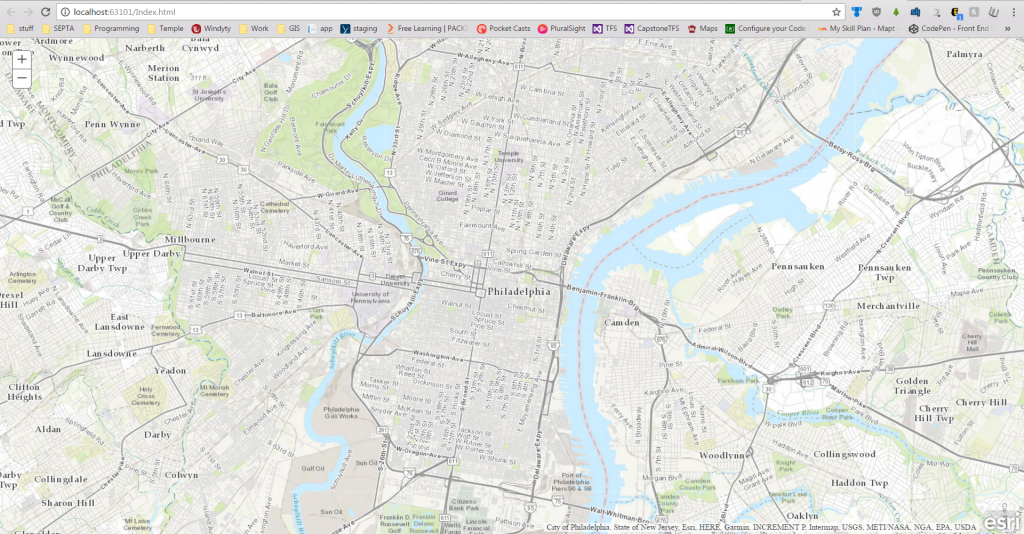
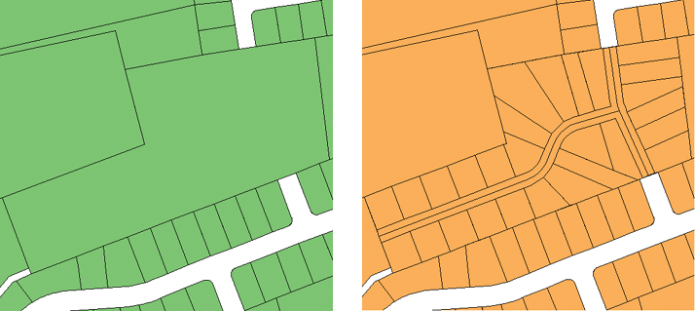
The result of running the SQL script to cut a single polygon by the union of several other polygons.

After running the script on a sample of data, the result can be seen above. The light blue outline represents the original polygon, while the smaller light green parcels represent the new subdivisions.

Creating a Network Analysis Dataset and Generating a Service Area Layer

Network analysis can be an extremely beneficial tool for any organization which relies on GIS to understand the area it serves. This is particularly true if the organization deals primarily with transportation or the distribution of goods. The network analysis package through ArcGIS allows organizations to gain critical insight into how people and goods move around within their designated service or study area. More specifically, the engineers that I work with at McMahon utilize GIS network analysis to gain enhanced insight on the regions in which they serve as transportation engineers and planners. The baseline method of analysis utilized is creating a service area layer, or series of layers, to gain an understanding of how much distance can be traveled on a road network given a set of parameters.

A Basic Example of a Service Area Layer, With Three Interval Breaks

The first step in creating a service area layer is to create a network dataset. A network dataset is a special type of ESRI dataset, which contains both spatial layers and network layers, as well as custom preferences and parameters to fine tune the output of the network dataset. To create a network dataset, first, download a road network layer that represents the area in which you want to create service areas. Often times, these layers are available from government agencies. For example, all Pennsylvania state and local roads are available on PASDA, provided by PennDOT. Once the streets / roads layer is downloaded, it is important to clip the layer to what you expect you might utilize from the service area analysis. If you choose not to clip the layer, you may find creating and working with the network dataset to be slow and difficult to manage.

You will also need to create a source point file that will represent the location or locations from which the service areas will be generated. You can create the actual points either now or after the network dataset is created, but the point feature class itself needs to be created beforehand. You will also need to create a file geodatabase and feature dataset to store all of these layers and datasets in.

Once the layer is downloaded, clipped, and present in your working directory with the source point file you can create the network dataset. This can be done by right-clicking inside any feature dataset and clicking new > network dataset. A dialog window should appear with options regarding the new network dataset. Name the network dataset and click next. You can leave most of the settings at their default values unless otherwise instructed or if you know the network dataset will be used for purposes in addition to creating a service area. Finally, on the second to last page of options, check the box next to “build service area indexes”. This will speed up the creation of service areas in the future.

Creating a New Network Dataset Inside of a Feature Dataset

Click finish, and you will be asked if you want to build the network dataset. Click Yes. Once the network dataset has been created, open ArcMap and bring the newly created network dataset into the dataframe. When prompted to bring in any associated layers, say yes. Add the Network Analyst toolbar and click “New Service Area” under the Network Analyst dropdown.

Creating a New Service Area with Network Analyst

Click the button directly to the right of the Network Analyst dropdown, to open Network Analyst Window. Here, you can load any origin points (previously created), polygon or line barriers, as well as set options for the service area that is going to be created. You can drag the point layer which contains the origin points into the Facilities group. Clicking the Service Area Properties button (top right corner of the Network Analyst Window) will allow you to set important preferences for the service area that is about to be created. Some of the most useful settings include the accumulation tab, which allows you to track distance and time along the service area, and the analysis settings tab. The analysis settings tab will allow you to set the direction of the service area, as well as any breaks, and to implement a temporal aspect to the service area.

Service Area Properties

Apply any preferences and settings that have changed, and close the service area properties window. When everything is configured as desired, click the Solve button on the network analyst toolbar to run the analysis and create the service area. The analysis can be re-run an infinite number of times, and with the service area index that was created earlier, creating a service area should not take long each time. This way, you can tweak and fine tune the service area quickly and easily until you gain the desired result.

A Service Area Created Using Network Analyst

Creating A Basic WebMap with ArcGIS API for Javascript

While ArcGIS Online provides a lot of great functionality out of the box, sometimes there are levels of customization that can only be brought about by designing a webmap programmatically. Fortunately, there are several Application Programming Interfaces (APIs) that take care of a lot of the baseline programming required for creating a custom webmap. Two of the most popular APIs include Leaflet and the ArcGIS API for Javascript. Although Leaflet is what is taught at Temple in GUS 4064, Web Mapping and Map Servers, I will be focusing on the ArcGIS API for Javascript. The concepts are the same, however, the ArcGIS API provides built in support for vector (SVG) path map graphics, which will be the focus of the next blog post. This post will focus on the basics of getting a webmap up and running using the API.

Unlike its desktop environment counterpart, the ArcGIS API for Javascript is free to use. They do, however, charge you to utilize their more advanced online analysis services, such as performing network analysis or geocoding locations. For the purposes of creating a simple and interactive webmap, what is provided for free should suffice.

The first step is to download a code editor that will allow you to write code for basic web development. There are many options that will work for the purposes of this blog post, and you may already have a favorite picked out and installed. After installing your code editor of choice, create a working directory where you will save all of the files create which store your code. Once you have the directory created, open the newly installed code editor and create a blank / empty document. Save this document as Index.html into your working directory. This will both create the file in which your code will be saved, but also let your editor know that you are going to be writing an HTML document.

By following the instructions on this page, I was able to create a functioning webmap based off of the code below:

Code to Create a Basic Webmap

There are three primary components to a basic webmap using the ArcGIS API:

  1. Referencing the ArcGIS API, this line essentially attaches your code to all of the functionality that has been pre-programmed and designed by ESRI.
  2. Create the map HTML element (above 2). This creates a div element in the HTML page that will be fill with the map content. Below 2, Initializing the function that creates the map. This is a Javascript function that actually creates the map seen in the div element. You can set properties in this function, such as the basemap (more can be found here), an array containing the default map center, and default zoom level.
  3. Lastly, setting the CSS style to take up space in the browser window. You don’t have to use 100%, but the body / map must use some portion of the window in order for you to see it.

Opening the Index.html file by either running it from your code editor, or opening it from the file explorer will allow you to preview the map you have created.

A Basic Webmap

Feature Layer Views & Symbolization in ArcGIS Online

ESRI recently implemented new functionality into ArcGIS Online which greatly expands the ability of the webmaps that are created and hosted there. Called “Feature Layer Views”, this new type of data storage allows a commonly utilized symbolization method in desktop GIS to be applied to ArcGIS Online feature layers. In a desktop GIS application, a single spatial file can be represented in a dataframe one or more times. Each instance of the spatial file can have its own unique symbolization settings and templates applied to it. This is a great way to reduce duplication of efforts when creating maps , while at the same time visualizing information from more than one attribute.

Around the beginning of the new year, ESRI released new functionality to ArcGIS Online which facilitates this. As previously mentioned, this functionality is called “Feature Layer Views”, and a basic diagram of its usefulness can be seen below.

To begin creating and utilizing feature layer views, open up the feature layer which you would like to create a view for in the My Content section of ArcGIS Online by clicking on the layer name. You will notice to the right there are several options, select Create View.

Assign a unique title, description, tags, and a location to save the view and click OK. Open an existing webmap, or create a new webmap to display the data in. This can be different than the map in which data collection is being performed, or the same one. In many cases, it may be more desirable to create a new webmap strictly for displaying information and tracking the collection of data.

Once the webmap is open and the source feature layer and feature layer view have been added to the map, you can begin modifying symbology for one or both layers. Since, in the example I have been using, symbology was defined before uploading the feature layer, I will only demonstrate modifying the view’s symbology.

Feature Layer & Feature Layer View in the same webmap

Note the two layers listed in the image above. If data is added or modified to one of the layers, the change is reflected in both. Both the view and the source feature layer can be configured to allow or disallow editing and creation of data. In cases where a source layer and a view are in the same map, you may want to disable editing and creation of data in the view. However, if you want to utilize different symbolization throughout several different webmaps, you may want to allow editing and creation of data across both the feature layer and its view.

To change the attribute that a feature layer or view is being symbolized on, click on a feature layer or view’s name and then click “Change Style” (the button that appears as three shapes). Next, choose the new attribute you wish to symbolize on. A common use of views is to symbolize an attribute that represents a feature’s condition or status. This way, you can see the type of feature and an additional descriptive which may influence the action that needs to be taken on that feature.

In the example I have been working with, which can be seen below, by adding a simple shape and associating a color to the condition attribute, we are able to see both the Signs Type and Condition without switching symbolization methods.

Signs Symbolized by Type and Condition

Gathering Data in the Field with the Collector for ArcGIS App

When I first started working with GIS, I often wondered, where did all of this spatial data come from? As I progressed through my initial undergrad coursework and internship experiences, the answers quickly revealed themselves. Some of the data is created by someone sitting at a desk. Other data is automatically generated as a subset or byproduct of another dataset. A large amount of data, however, is collected on-site, by people in the field.

When I began my first internship I was doing exactly that. Weather permitting, I would be out in the field collecting data with a high-tech, high-end Trimble GPS.

As many of us know, GIS does not typically have the capability or need to achieve survey-grade accuracy. For this reason, it has become an increasingly popular choice to skip purchasing a $10,000 GPS unit and instead purchase an Android tablet or iPad for $1000 or less. This trend has been on the rise ever since powerful tablets with an acceptable battery life for mobile data collection became an affordable option. Because of this, GIS software companies have developed native Android and iOS apps for mobile spatial data collection. There are several apps out there, including free and open source options. Data collection with these native apps can even be performed on a smart phone.

            Two Options for Mobile Data Collection

This post will focus on ESRI’s Collector for ArcGIS app, as it will tie in with the article I wrote two weeks ago detailing how to create and host a dataset in ArcGIS Online tailored for mobile data collection.

Collector for ArcGIS

The Collector app is available on the Google Play store for Android and the App Store for iOS. After downloading the app, login to your organization’s account just as you would on ArcGIS Online. Any webmaps that exist in your organization’s ArcGIS Online account will be visible in the Collector’s main menu.

Collector for ArcGIS Main Menu

Select and open the map that you wish to collect data in. In this case, the Inventory map that was created in the previous blog post. The Collector’s map interface is relatively simple and its capabilities are intuitive and user friendly. Depending on your device, the layout may be slightly different, but the same functionality is present across all device types. Below is a screenshot of the initial Collector window, with a brief outline of what each button does.

  1.  The maps button will return to the main menu.
  2. The find my location button will use your device’s built in GPS to find your location and display it on the map.
  3. The bookmarks button allows for saving of specific locations / map extents as bookmarks. This eliminates the guesswork if you need to quickly reference or jump between two areas.
  4. If you are collecting more than one type of feature, the Layers tool is useful for turning on and off datasets when one type may not be in use.
  5. The search tool works like a Google Maps search, allowing you to search for and zoom to any location on Earth. It can also be configured to search through attribute values for a feature layer in the map.
  6. The measurement tool allows you to measure distances and areas by drawing temporary lines and polygons on the map.
  7. The basemap tool allows you to select and change the basemap. Available basemaps include Topographic, Imagery (and an option to include labels), OpenStreetMap, ESRI Streets, Terrain, and the USGS National Map, among others. You can also create and load a custom basemap if, for example, you have higher resolution imagery available for your study area.
  8. Clicking on or dragging the plus sign to the left will allow for the creation of new features. Feature templates defined in ArcMap or ArcGIS Online will be visible here for any feature layer that is present in the webmap.

Once you’ve familiarized yourself with the tools available in the Collector, you can begin collecting data. Click on or pull the plus sign (point 8) to the left to see templates available for creation. On some versions of the Collector, the location of the feature will automatically be assigned your current location. If this doesn’t automatically begin, you can click the symbol that looks like a person with the find my location target next to it to use your location for the feature. You can also tap any location on the map to set the feature’s location to that point. The Collector also allows you to draw vertices for line and polygon feature layers this way. There is also the capability to “walk” a line or polygon feature, the Collector will drop a verticy at a predefined distance as you walk along a feature until you tell it to stop.

A Feature Collected in the Field

Next, you can begin assigning values to the attributes for that feature. Note that the domain value lists are present for the attributes that you configured to have them. This helps to greatly streamline a collection effort and can cut the time it takes to collect a single feature tremendously. Editing can be done in the field if any mistakes were made, and the progress of the inventory can be seen back at the office in real time as the collection effort occurs in the field.

In the next blog post, I will go further in how to utilize ArcGIS Online’s suite of tools to better represent, share, and understand the data that has been collected.

Creating and Storing Your Data in the Cloud with ArcGIS Online

This post and several posts to follow will detail how to design, host, and implement an effective asset inventory using the ArcGIS for Desktop Suite and ArcGIS Online, in conjunction with the Collector for ArcGIS app (Android, iOS, Windows 10).

Note: In order to utilize the Collector for ArcGIS and publishing ArcGIS Online services from ArcMap, an ArcGIS Online subscription is required. 

Step 1: Creating a Dataset

If you are both designing and utilizing the dataset that will be created through the data collection effort, congratulations, you might already know exactly what you want to collect and how to design your feature classes and attributes. However, if you are developing a GIS solution for someone else, it is important to work closely with that person to identify exactly what information is going to be collected before there are people in the field collecting. It is much easier to make a change to a domain value / max field length before an ArcGIS feature layer is deployed to the cloud.

Fortunately, feature classes have built in quality assurance capabilities and they translate well into ArcGIS Online. These QA measures come in the form of domains. Domains in the ArcGIS for Desktop environment turn standard text attributes into dropdown lists. This is great for preventing varied user data entries (think Yield vs Yield Sign vs Yld).

Domain Definitions

Domain Definitions in an ArcGIS File Geodatabase


Feature Class Attribute Creation, with Domains Assigned

After that, create the feature class that will act as a template for the ArcGIS Online feature layer. Be sure to assign the domains to the appropriate attribute as you are creating attribution for the feature class. You can also define feature templates and symbology now, or after the feature layer is published to ArcGIS Online.

Step 2: Publishing Feature Classes to the Cloud

Add that newly created feature layer into an ArcMap session. As stated above, you can define templates and symbology now or later in the cloud. I opted for the former, because I liked the symbology options that were available in ArcMap.

Publishing a Feature Class with Symbology Loaded into ArcMap

Sign in to your ArcGIS Online account via the File menu, and publish the service using File:Share As:Service (seen above). In the dialog window that appears, select Publish a Service and click next. Name the service, and click continue.

In the service editor that appears next, be sure that the service being published has the Feature Access option checked under Capabilities, as well as at least the Create and Update Operations allowed (seen below). Enter a summary and tags as required, and click the publish button to begin creating an ArcGIS Online Feature Layer.

Configuring a Feature Service to have Add and Edit Capabilities.

Step 3: ArcGIS Online & Beyond

Log in to your ArcGIS Online account from your web browser. From your organization’s home page, click on My Content, this is where your newly published feature layer is being stored. Use the Create: Map menu item to create a new web map to utilize and share the feature layer. The new map will automatically open. Using the Add menu item, search for your newly created feature layer and add it to the map. Be sure to save the map after adding the feature layer.

From here, you can add data and alter symbology and the basemap. The webmap can be public facing or private, and shared via link or embedded into another website via HTML.

An ArcGIS Online Webmap with Fields and Domains Created in ArcGIS Desktop

In the next blog post, I will go into detail about collecting data with the Collector for ArcGIS app for mobile devices.