

ESRI recently implemented new functionality into ArcGIS Online which greatly expands the ability of the webmaps that are created and hosted there. Called “Feature Layer Views”, this new type of data storage allows a commonly utilized symbolization method in desktop GIS to be applied to ArcGIS Online feature layers. In a desktop GIS application, a single spatial file can be represented in a dataframe one or more times. Each instance of the spatial file can have its own unique symbolization settings and templates applied to it. This is a great way to reduce duplication of efforts when creating maps , while at the same time visualizing information from more than one attribute.
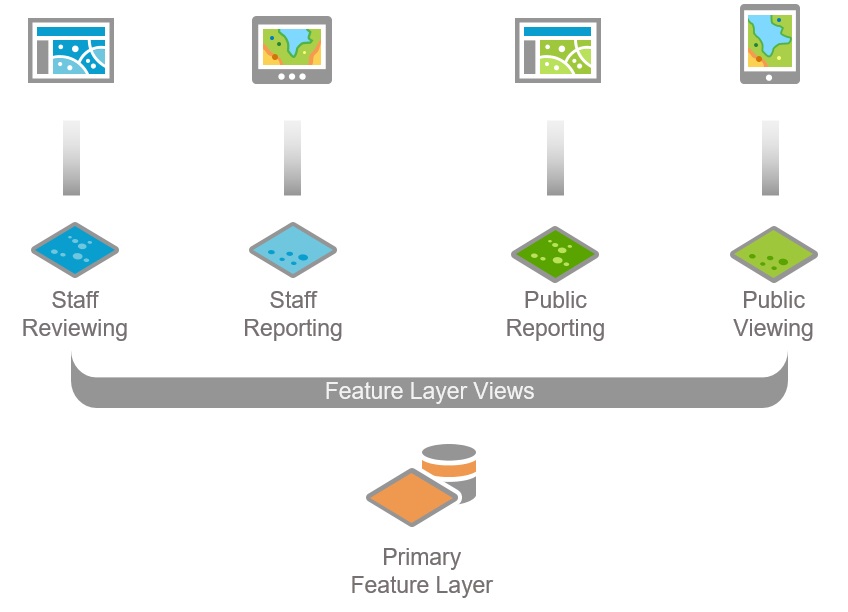
Around the beginning of the new year, ESRI released new functionality to ArcGIS Online which facilitates this. As previously mentioned, this functionality is called “Feature Layer Views”, and a basic diagram of its usefulness can be seen below.
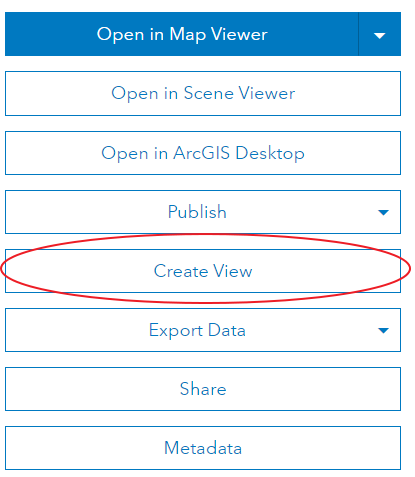
To begin creating and utilizing feature layer views, open up the feature layer which you would like to create a view for in the My Content section of ArcGIS Online by clicking on the layer name. You will notice to the right there are several options, select Create View.
Assign a unique title, description, tags, and a location to save the view and click OK. Open an existing webmap, or create a new webmap to display the data in. This can be different than the map in which data collection is being performed, or the same one. In many cases, it may be more desirable to create a new webmap strictly for displaying information and tracking the collection of data.
Once the webmap is open and the source feature layer and feature layer view have been added to the map, you can begin modifying symbology for one or both layers. Since, in the example I have been using, symbology was defined before uploading the feature layer, I will only demonstrate modifying the view’s symbology.
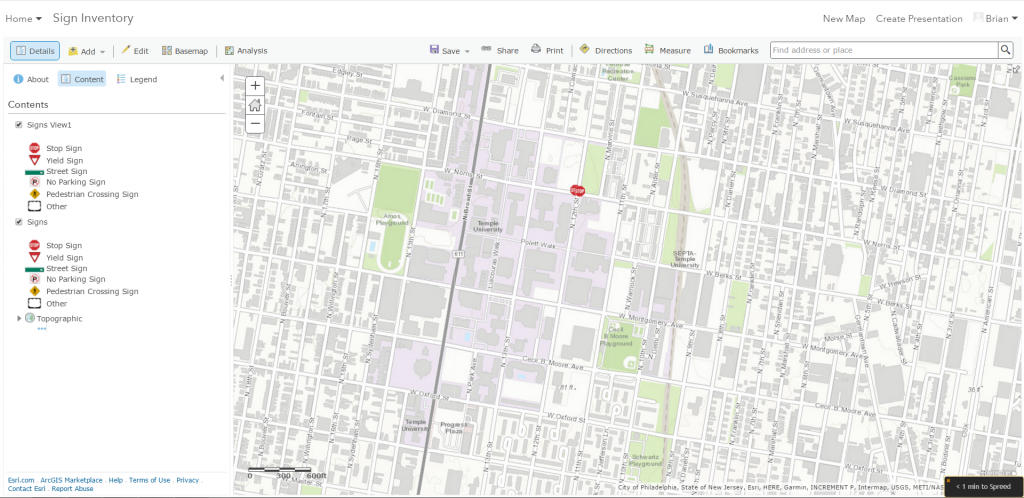
Feature Layer & Feature Layer View in the same webmap
Note the two layers listed in the image above. If data is added or modified to one of the layers, the change is reflected in both. Both the view and the source feature layer can be configured to allow or disallow editing and creation of data. In cases where a source layer and a view are in the same map, you may want to disable editing and creation of data in the view. However, if you want to utilize different symbolization throughout several different webmaps, you may want to allow editing and creation of data across both the feature layer and its view.
To change the attribute that a feature layer or view is being symbolized on, click on a feature layer or view’s name and then click “Change Style” (the button that appears as three shapes). Next, choose the new attribute you wish to symbolize on. A common use of views is to symbolize an attribute that represents a feature’s condition or status. This way, you can see the type of feature and an additional descriptive which may influence the action that needs to be taken on that feature.
In the example I have been working with, which can be seen below, by adding a simple shape and associating a color to the condition attribute, we are able to see both the Signs Type and Condition without switching symbolization methods.
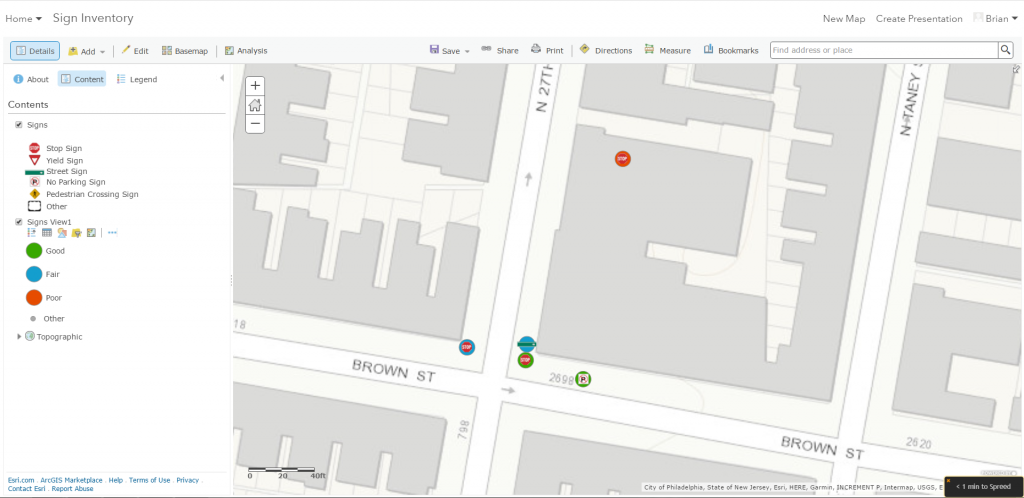
Signs Symbolized by Type and Condition