https://philadelphiasafeschoolwalkingroutes.wordpress.com/2018/08/04/building-safe-school-walking-routes-with-network-analyst/

https://philadelphiasafeschoolwalkingroutes.wordpress.com/2018/08/04/building-safe-school-walking-routes-with-network-analyst/
Have you ever wanted to create a 3D map, well WRLD has a free solution for you to use. WRLD is a geospatial company that provides users the ability to create 3D maps through the use of their free API. WRLD uses reputable sources for their geospatial data including OpenStreetMap, USGS, NASA and more. The first step towards creating 3D maps is to create a WRLD 3D account at https://www.wrld3d.com. Once your account has been created and verified, you will then need to create an API key which is located under your account information. Each user will have an unique API key that will be used by WRLD to track the amount of usage. The API key is free as long as you have less than 60,000 users / web views per month.
In this example I used the Brackets text editor which is available for free to download at http://brackets.io. Brackets is cross-platform and interactive with Leaflet which is an open source map based on Javascript, HTML and CSS. Additional coding tips are available on the Leaflet tutorial site at https://leafletjs.com which includes tutorials and code snippets. To begin, open up Brackets and copy the following code into brackets–see the # sign for a description of the line of code and line comments for a description of a block of code:
<!DOCTYPE HTML>
<html>
 <head>

<!–Copy and paste to reference WRLD’s 3D mapping–>
   https://cdn-webgl.wrld3d.com/wrldjs/dist/latest/wrld.js
   <link href=”https://cdnjs.cloudflare.com/ajax/libs/leaflet/1.0.1/leaflet.css” rel=”stylesheet” />
 </head>
 <body>

<!–  Change height to match parameters of your website/screen    –>
//Insert your API Key below
     var map = L.Wrld.map(“map”, “Insert API Key Here”, {
       //The center point of the map
       center: [39.981358, -75.152776],
       zoom: 17//zoom level of map–set below 18 to see 3D detail
     });
// Name to be displayed when marker is clicked
var school = “Gladfelter Hall”;
//Location of marker. Latitude/Longitude can be found from Google Maps by right clicking and selecting what’s here?
var marker = L.marker([39.981358, -75.152776]).addTo(map).bindPopup(school);
 </div>
 </body>
</html>
Make sure to save the file with the extension with .html within Brackets in order for it to work using your localhost. Once connected to the live preview (volt button on top right), the maps will be seen below. Also, you will be able to zoom in and out by “pinching.” 3D coverage is available throughout the world in major metropolitan areas and additional areas can be built for a fee from the WRLD company.
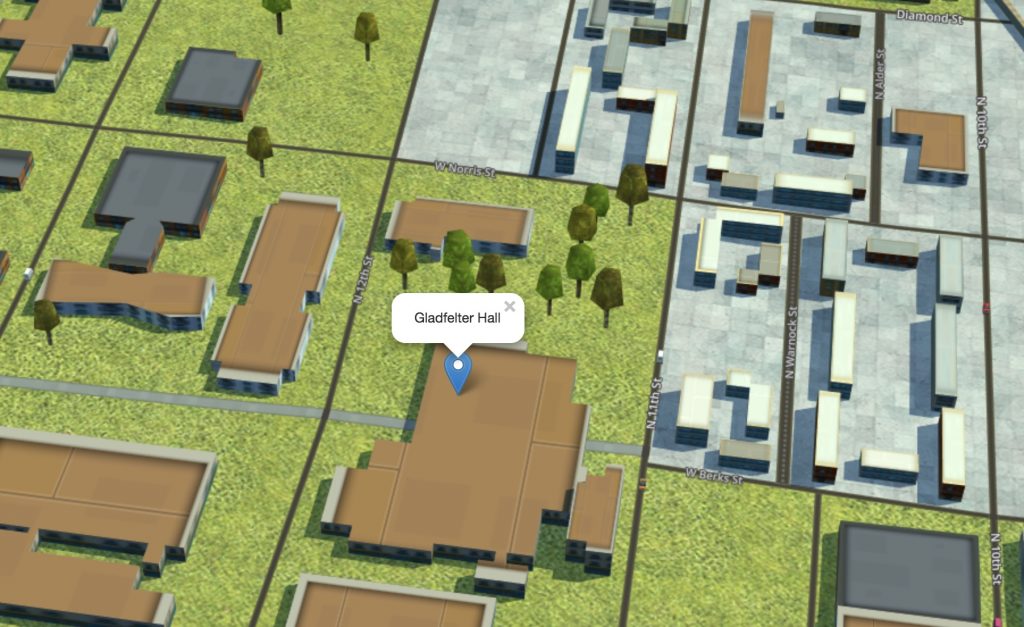
Gladfelter Hall in 3D
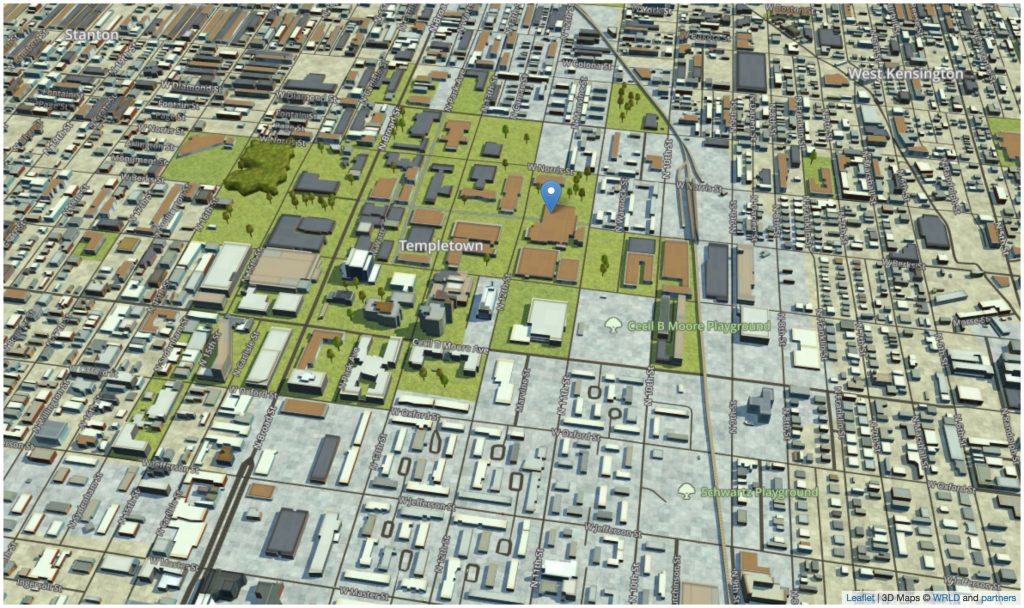
Temple University in 3D
Confession: I am terrible at keeping my own files. Really bad. Like a digital version of those houses you see on ‘Hoarders’. Yes, at work I can handle our naming systems and organizational structures, but navigating my personal computer is like navigating a maze. Its exhausting. As a result of this digital mess, I got into an unsustainable pattern of re-downloading files from the original internet source instead of finding the version I had already saved. You don’t want to know how many “2010_Census_Tracts_Phila.shp” are probably weighing my computer down right now. With that being said, here is how my poor computer is able to preserve its remaining disk space: Server connections and API links. Two terrible sounding phrases, no? No. They are not nearly as complicated as I once thought and I will prove it.
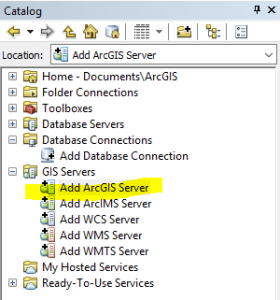
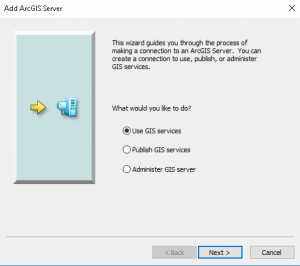
I was thrown into the world of GIS Servers as part of a project at work only a few months ago. Now I feel confident working with GIS Servers and have even started to prefer pulling API data rather than using old static shapefiles. Here is how to quickly bring in data stored on a GIS Server to enhance your project and ensure the most up-to-date accuracy:
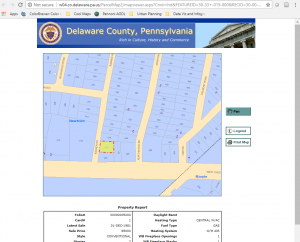
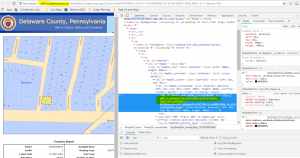
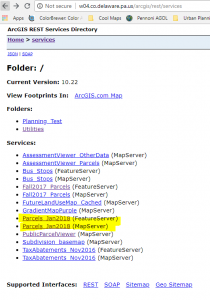
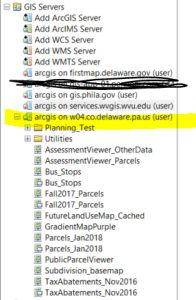
And now you have basically any and all of the GIS data on the Internet!
Ok, obviously not all of the GIS data on the Internet, but now you have the tools to access a lot of data that might have seemed inaccessible to you before. If anything, I hope these instructions help any other digital hoarders whose computers have suffered long enough.
There may be times where you have a set of points (say from a GPS receiver) and need to create a path that connects them. There is a useful tool in the processing toolbox in QGIS that enables the connection of those points, allowing you to determine the drawing order points and the resulting path or polygon.
This discussion starts with the assumption of some kind of geospatial point data in a CSV file. At the very least, the points should have an X and Y value that QGIS can interpret, and it is a good idea to have a field in the data that specifies the drawing order, since the resulting paths can vary widely for the same set of coordinates, although any numerical field can be used to set the order. Once your data is set up and imported into QGIS as a delimited text layer, pull up the “points to path” tool in the processing toolbox. The input layer and drawing order field need to be set, but there is also a field that allows for the grouping of features, which outputs individual line features per group as well as a field to enter a storage location for the resulting vector file.
The examples below shows the output of this tool. This is a set of five airports (Atlanta Hartfield-Jackson, Chicago O’Hare, Washington Dulles, Dallas-Fort Worth and Los Angeles International, in that order), connected by the resulting path based on a “drawing order” field in the data. By editing that field, I can get a different path result from the same data points, as shown in the second example. I chose this data in order to present this tool in a broad context, although it seems to be useful at much larger scales.
It is worth noting that these paths are treated the same as any other vector paths in QGIS, that is, they can be styled and edited just like any other, including adding nodes and changing start and end points. They are not connected to the layer from which they were created, but are completely independent. They do not follow any network other than the drawing order, so there is limited use for this technique for determining distances over a large area, but it could be useful when looking at points arrayed in a small region. Another useful application of this tool might be in collecting handheld GPS data (from a simple device such as a phone) of corners of a piece of property and converting them into a polygon (with the aptly named “lines to polygons” tool, also in the processing toolbox).
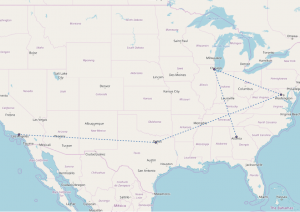
Points connected to each other by path, based on the drawing order in the data table for the point layer.
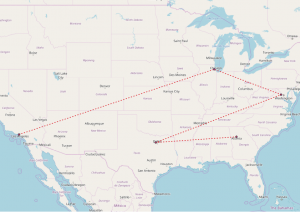
Same set of points as before, but this time with a new drawing order in the data table. Any numerical field can be used to determine the order of connections.
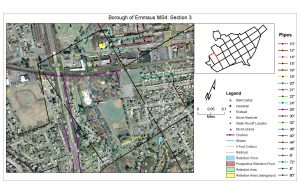
In 2017, I was an intern for the Borough of Emmaus, a small borough of roughly 11,000 people located in eastern Pennsylvania. While employed, I was tasked with creating a map of the entire borough that was required to show certain datasets and information. The information that was required included storm water pipes, water flow direction, outfalls, inlets, bodies of water, retention areas (present and proposed), manhole covers, and elevation contours. All of this information was required by a program being run by the State of Pennsylvania entitled the “MS4 program”. Creating of the program was done to comply with the federal clean water act, with the main goal being cleaning up the pollutants in our bodies of water.
One of the main challenges I was working with regarding this project was that I was the only person employed by the Borough that knew how to work a GIS software, let alone know what GIS even is. This was an obstacle I did not think I was getting myself in to. Trying to explain the processes that were happening and needed to be completed to other borough employees was challenging. Another facet of this issue was that I didn’t have a single person to bounce ideas off of o anyone to ask a question to if I got stuck. For someone that never worked a job using GIS and still completing their bachelor’s degree, this was a massive learning curve. Another major problem I had to deal with was the borough didn’t have any type of GIS data readily available. Some datasets I had to download (like borough boundaries and aerial imagery), while others I had to manually create by myself. All of the storm water pipes were hand drawn onto paper maps by the water department and I had to spend quite a lot of time digitizing every pipe segment as well as inputting the attribute data associated with each segment. For one man to complete nearly one thousand pipe segments, this took some time.
Once all of the leg work was completed and compiled onto a functioning map, it was then able to be submitted. For the borough, since they did not have any GIS professionals on staff, they first sent the finished map to be revised by an engineering firm that specialized in this municipal storm water program. A few weeks later, they approved the map and it was submitted to the state department of environmental protection.
As seen below, this map is only a subsection of the much larger map. Subsections were created to be able to get much better resolution of every storm water pipe and so the water department could carry these maps with ease.
All in all this project and internship was a difficult task for me at the time and made me learn a lot about GIS and the GIS profession in a short amount of time. Just because a project may sound easy doesn’t necessarily mean it will be just that. A lot of times there are various issues and problems that are encountered which increase the difficulty of the project. It is important to learn and adapt to every project that comes in front of a GIS user, and I learned doing this will make you a much better GIS professional in the future.