In May of 2019, I started an internship at the Economy League of Greater Philadelphia working as a Justice Policy Research Intern. During the first three months, I was working on a Criminal Justice Research project pertaining to the economic impact that a pardon could have on an individual with a criminal record, as well as their families and communities. My main tasks for this project were to conduct literature searches that would inform the basis of the project as well as design maps on socio-demographics, arrests rates, pardon applications filed and granted (2008-2018) throughout the state of Pennsylvania. Moreover, there was an emphasis placed on five key counties that had high arrest rates that included: Philadelphia, Bradford, Dauphin, Potter, and Allegheny County.
Following that, the data used in creating these maps came from the United States Census Bureau, Federal Bureau of Investigations, and the Pennsylvania Board of Pardons. I created approximately 60 maps for the project that my supervisor asked for but due to time restraints and the narrowness of the project, only two of the maps I created were included in the final product (http://economyleague.org/uploads/files/518454652334570386-impactofpardons-final.pdf). Those maps displayed rates for pardon applications filed and granted over top of county arrest rates for Pennsylvania. Pardon applications and grant rates were visualized using graduated symbols technique, while the arrest rates used a graduated color method.

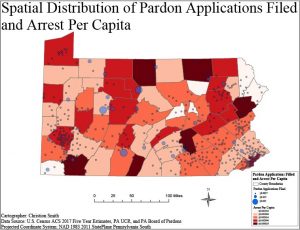
Figure 1: Pardon application rates over top of arrest per capita in Pennsylvania.
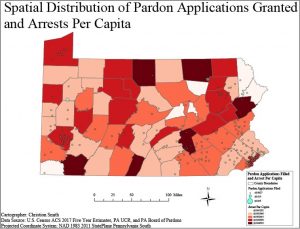
Moreover, the pardon application data were allocated to the zip code level, and the arrest rates were designated at the county level. These two geographies were overlaid with one another to create the two maps. Figure 1 displays a map showing pardon application rates over county arrest rates. In looking at this map moderate and high arrest counties have lower rates of pardon applications filed, while low arrest counties have a higher rate of pardon applications filed. Additionally, low rates of pardon applications filed seem to be concentrated in the southeastern (Philadelphia County) and western (Allegheny County) portions of Pennsylvania. Next, figure 2 shows a map of granted pardon rates over county arrest rates. In this map grant rates for pardons appear to be lower across the board except for in counties such as Bradford, Venango, and

Figure 2: Granted pardon application rates over top of arrest per capita in Pennsylvania.
Washington County that have rates of 0.035. These two maps taken together show that the rate of pardon applications filed and pardons granted are higher in less crime-ridden communities, while higher crime-ridden communities have lower rates of pardon applications filed and granted. This spatial analysis revealed a disparity in how pardons are distributed to certain types of communities.
Overall, I found this project to be rewarding in that I got to utilize my knowledge of criminal justice that I obtained from my undergraduate education in conjunction with my coursework in the P.S.M program. Ultimately, this enabled me to craft nice map visualizations and contribute in a meaningful way to criminal justice policy, while gaining practical experience in the application of GIS for public policy.
