Using FFmpeg as an Animation Conversion Command Line Tool

Editing maps and doing data analysis, that’s my thing! But when it comes to video editing, I’m a bit out of my league. In addition to that, I have no expensive software that will make things look cool and fun. Or at least I thought I didn’t.

FFmpeg is “a complete, cross-platform solution to record, convert and stream audio and video.” You can download it here. This tool is limitless when it comes to production.

So, working with the time series images that I created from the precipitation data and working with FFmpeg, I was able to create an animation!

You’ll be working in command line window so you need to know where that lives. For me and my Windows 10 computer, it lives here … “C:\Windows\WinSxS\amd64_microsoft-windows-explorer-shortcuts_31bf3856ad364e35_10.0.10586.0_none_443d824ebb4341e2\01 – Command Prompt.lnk” but it may be easier just hitting the windows start button and typing command prompt.

ffmpeg -framerate 24 -i Rplot_%04d.png output.mp4

My images were named Rplot_0001.png. If your image was named img_001.jpeg you would refer to your image as img%03d.jpeg. That took me a few minutes to figure out but after I hit enter, I had a time series precipitation video. I wasn’t very specific in my frame rate but you can be. I received a lot of help from this FFmpeg wiki.

imagestovideo

Plotting Time Series Graphs for Animation with MapMate Package in R

Animations can be a little tough to create but luckily, Matthew Leonawicz has created a package for R that plots and saves images easily called MapMate. The map portion of the package I have yet to master, as it is globe based and my project was to map a static city. But the time series climate data of precipitation that I collected from The National Oceanic and Atmospheric Administration Department of Commerce was a great project to produce an animation.

Needed for the images to save is ImageMagick which is a free download.

The first step to creating an animation was to make a sequential numeric column named FrameID for the order of plotting. The next step was to identify the x limits and the y limits.

climate1 <- climate
climate1$FrameID <- 1:nrow(climate1)                  
xlim <- range(climate1$Date)
ylim <- range(climate1$Percip)
save_ts(climate1, x = "Date", y = "Percip", id = "FrameID", col = "grey",
         xlm = xlim, ylm = ylim, dir = "C:/Users/tuf29742/Documents/Vector Control/Animation/")

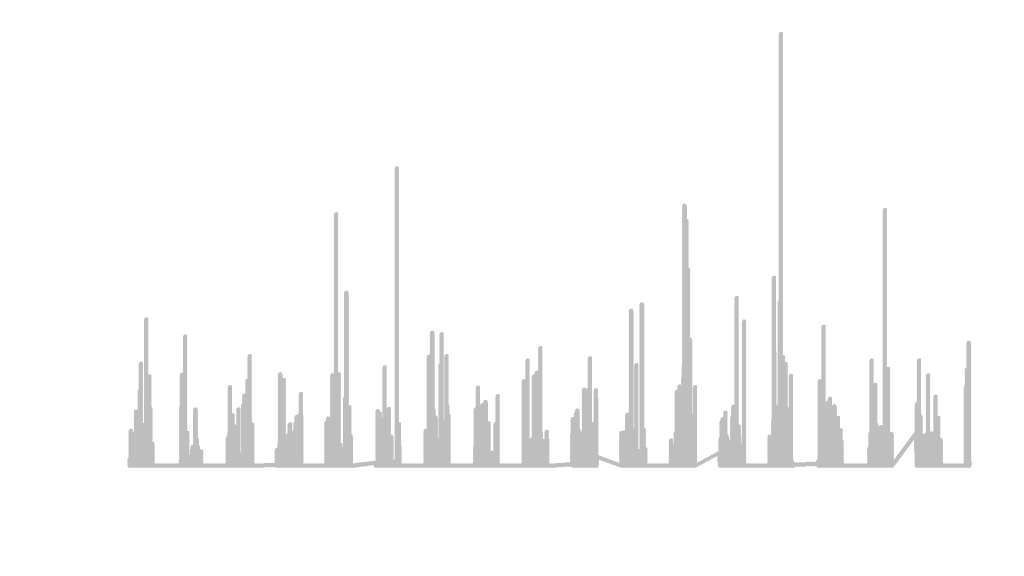
With x as the date and the y as the precipitation, and a specified location for the images to be saved, this image creator took roughly 30 minutes to produce 3,159 images for animation. Below are just 5 images from the package capture.

These images could now be used in a video editor to create an animation. I would check out Matt’s MapMate Instructional Page for more fun with animation!