
Temple and Villanova installed a network of soil moisture sensors at a depth of 10 cm at the newly renovated Stormwater Management Projects I and J along the flank of Highway I-95. Tracking the near-surface soil moisture history is important for understanding plant health in the basins. The sensors also monitor electrical conductivity, which we plan to use to track road salt influx during the coming winters.
Below is an image of the soils sensor locations superimposed on a digital elevation model of the two basins created from LiDAR data collected at the site.
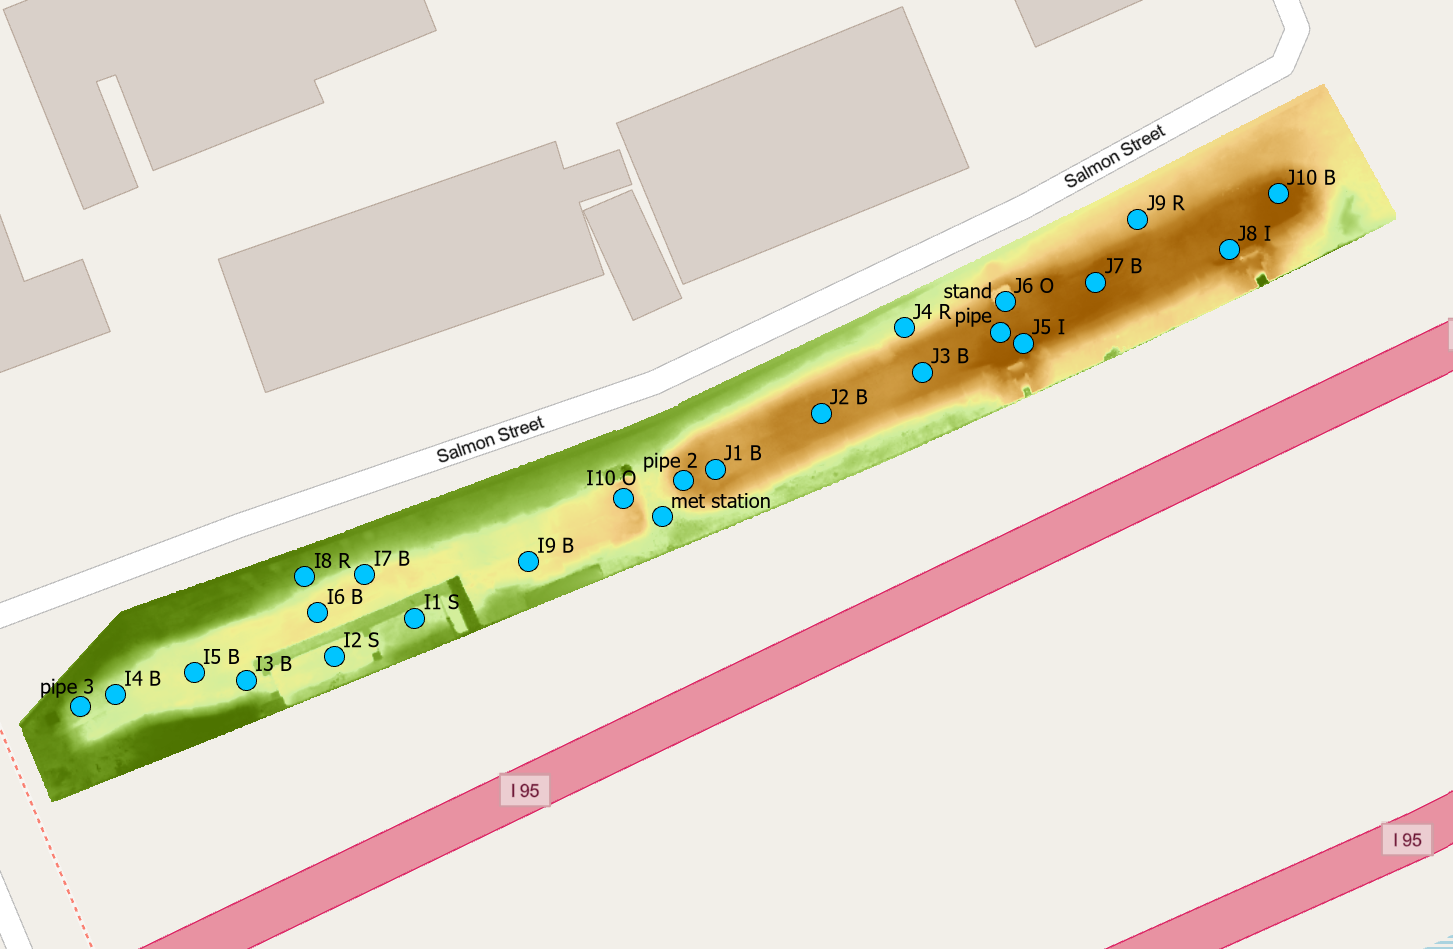
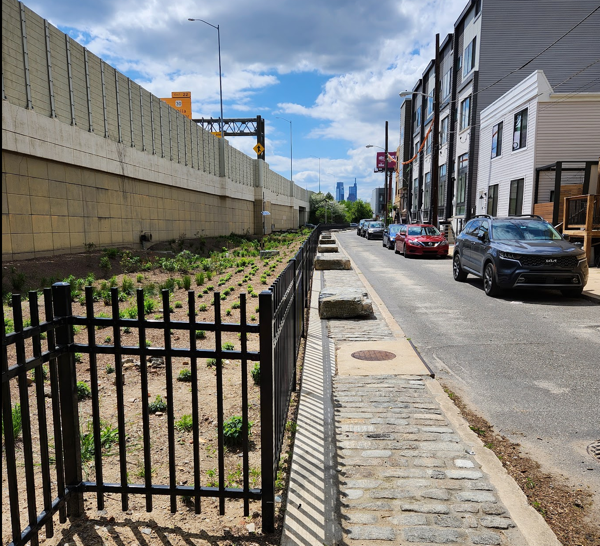
The image colors show the lower topography in browns shading to the higher topography in greens, but as you can see from the photograph, the entire relief is only a few meters. The sensor IDs start with I (Basin I) or J (Basin J) and are numbered followed by a letter: O for sensors near an outlet, I for sensors near and inlet, B for sensors along the floor of the basins, and R for reference sensors place on the basin flanks above anticipated flooding levels.
Preliminary results show that moisture levels between storm events are highly variable across the basins. So to visualize the changes in soil moisture with storms, I have plotted only the changes in volumetric water content (m3/m3) for each sensor relative to its starting value on Feb 22, 2023. In the figure below the top graph shows the VWC at sensor J8-I near the inlet in the upper left of the figure above, which lets us see precipitation events. The figure below that shows the soil moisture sensor locations color-coded to show changes in VWC using a divergent color palette — reds for drying, blues for wetting, superimposed on a grayscale version of the DEM shown above.
It is interesting to observe that for none of the three storms does the basin fill. A few of the sensors along the floor of the basin show moisture increases, but no prolonged saturation. This suggests that eight it takes a large storm to flood this basin, or the outlet threshold is too low and needs to be adjusted to allow water to pond for infiltration. We will know better after we have enough data to include larger summer storms.
CLICK on the image below to see the animation. The animation advances in four-hour increments.
