- Multi-offset GPR
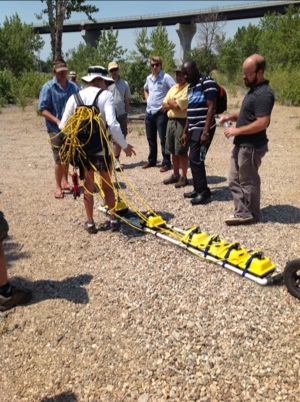
In July I attended an excellent Hydrogeophysics Workshop in Boise Idaho, which included a field trip to the Boise hydrogeophysics field site where I watched in interesting demonstration of downhole NMR and multioffset ground-penetrating radar. NMR was a popular theme at the conference and clearly the technology has captured the interest of the near surface geophysical community with its potential to return both water content and hydraulic conductivity (the holy-grail hydrogeophysics).
My own presentation was on electrical resistivity tomography for characterizing hyporheic flow and the challenge of constraining the water layer conductivity during inversion. Below is the abstract:
Time-Lapse Resistivity Monitoring of the Hyporheic Zone: The Water Layer Problem
Jonathan E. Nyquist, Laura Toran, David O’Donnell
Department of Earth and Environmental Science, Temple University, Philadelphia, PA
Interest is growing in using time-lapse electrical resistivity tomography (ERT) in conjunction with saline tracers to map hyporheic storage areas in streams and compare with tracer test breakthrough curves. To monitor the evolving subsurface conductivity using ERT it is necessary constrain the thickness and electrical conductivity of the stream water layer during data inversion because of the sensitivity of resistivity data inversion to the cells adjacent to the electrodes. This is a challenge because short time scale (e.g., diurnal) changes can occur in water temperature, stream stage, and the conductivity of runoff, and groundwater. We successfully used time-lapse ERT to find where saline tracer lingered in the streambed after a tracer test performed at Crabby Creek, an urban stream near Valley Forge, PA. The resistivity data were collected over a 13.5 meter length of the stream bottom parallel to flow using a 28-electrode dipole-dipole array with 0.5 meter spacing. Resistivity surveys were conducted consecutively, with each survey taking approximately 10 minutes to complete. Water samples were collected at two depths (20 and 40 cm) for multiple transects across the stream at 5 to 15 minute intervals to compare with the geophysical data. The ERT showed differential storage upstream and downstream of a restoration structure, and changes over the course of a year based on repeated surveys a year apart. However, in a nearly identical experiment performed in a creek at nearby Ecology Park, the ability to detect tracer was confounded by variations in both the stream and the subsurface during the course of the day. One difference between the two sites was slightly greater stream depth, >0.3 m at Ecology Park versus < 0.1 m at Crabby Creek. With this increase in stream depth there was greater sensitivity to the inversion starting model, greater uncertainty in shallow subsurface resistivities, and decreased ability to detect tracer with errors in estimation of stream variation throughout the day. Models to correct for changes in stream conductivity were investigated. Using best estimates for the stream resistivity, these models indicated a lack of tracer lingering in the subsurface, which may be explained by groundwater discharge at this site. Caution is needed when applying time-lapse ERT techniques without careful consideration of how the water layer impacts inversion.
For a similar experiment performed in nearby Valley Creek no tracer in the hyporheic zone was apparent in time-lapse images nor in water samples taken from wells during and after the injection. However, time-lapse resistivity did detect a gradual decrease in the resistivity of the shallow subsurface that could not be accounted for by changes in stream water conductivity. Modeling of diurnal temperature fluctuations measured in the stream sediments suggests that the portion of the stream monitoring during the tracer test was a groundwater discharge zone. The gradual increase in the shallow resistivity can be explained as a change in either the thickness or fluid conductivity in the top layer of sediments where stream and surface waters mix.