A Yogi’s Reflections on Change, and Charles

Charles Library

For a couple of years now I have been practicing yoga. I live near the studio and my routine is to have an early coffee then head over to the 6:30 session. It’s a good way to start the day and puts me in a positive frame of mind.

But this month two instructors have left the studio and we students now practice with “Jane”, who is just out of teacher training. It was awful. Nothing she did was right, from confusing left and right to selecting unpleasant music.  I would emerge from practice annoyed, and at times bitter and more stressed than when I arrived.

I was frustrated with my own impatience. I told myself to respect the process, to allow Jane the space to learn. That’s a value I tout all the time. But I was having some trouble practicing what I preach.

Yesterday’s class was quite different. It was still Jane. We chatted before class and got to know each other better. In practice, the shapes seemed not so strange and the music not so grating. I came away from practice refreshed and energized for the day ahead. Something had changed, but it wasn’t just Jane.

Change is annoying, and stressful, and makes us uncomfortable. Here at Temple University Libraries/Press, we are going through a lot of it.  The Envisioning our Future interview project was designed to explore with staff aspects of that change as we transition to Charles.

We are now wrapping up its first phase, providing for some self-reflection on our organization and our individual work. How do we anticipate our work with colleagues and with users will be impacted? What opportunities and challenges will we face? We hope to identify best practices when supporting this kind of dramatic change. The many participant voices have also brought to light the anxieties we are facing now, including my own.

But like a yogi  trying always to improve my practice, I feel I can adapt to that change. And will be both stronger and more flexible because of it. Next post, from Charles Library!

Posted in organization culture and assessment | Tagged | Leave a comment

“why can’t life just be easy !?”

One of our strongest educational partnerships here at Temple Libraries is our collaboration with the First Year Writing Program. Nearly all entering first-year students at Temple take at least one of the courses in this program, so it’s a great opportunity for library staff to reach a large population of undergraduates. Each section of the three largest courses (ENG 802, 812, and 902) is scheduled for two workshops with a library staff instructor. These workshops are designed to build on each other to support students as they work on increasingly complex research writing assignments throughout the semester.

One of the ways we assess our success in this program is by having students complete a brief, five-question survey after each workshop. In summary, the questions we ask on the survey are:

  • Who was your librarian?
  • What’s one new thing you learned today?
  • Rate your confidence BEFORE and AFTER this workshop.
  • What is one question you still have about using sources (after Workshop 1) / the research process (after Workshop 2)?

Though brief, these surveys are a rich source of data about our instruction. We tend to get a high response rate, because we have students complete these surveys while they are still in the classroom. While there are a number of potential findings from these results, in this post I will focus on major trends across all instructors. The results I discuss are from the Fall 2018 and Spring 2019 semesters.

Student Confidence

When designing these surveys, our curriculum working group struggled with the best types of information to gather in this particular context. If we quiz students on concepts we discussed in the workshop just minutes before, are we sure that their responses mean they can apply and retain these concepts? One measure we believed students could effectively self report on was their confidence about doing research. We hoped to learn if students felt increasingly confident after our workshops.

Our data suggests that students’ self-reported confidence did increase due to our workshops. The blue lines on the chart below indicated confidence before, while the green indicates confidence after. The results are on a scale from one to four, with the exception of Workshop 2 in Spring 2019, where we updated the scale to run from one to five, based on survey best practices. That’s why the very last measure is higher overall.

What Students Learned

One of our survey questions asked students to report one new thing they learned in each session. Overall, student responses were relevant to the workshop content, suggesting that students are paying attention and leaving with some of the concepts we discuss in mind. Students recalled specific databases by name, especially JSTOR and Academic Search Complete. Students also recalled the BEAM method that we discuss, indicating that perhaps acronyms and other mnemonics can help with learner recall.

Sometimes, though, student responses suggested a broader understanding of research than what we cover in the workshops. For instance, students often claimed that they left knowing “everything” about how to use the library, databases, and/or the library website, when we cover just a fraction of the available resources in each workshop. Students also sometimes misinterpreted concepts like BEAM, suggesting that while they remembered the name they may not have learned how it applies to their research process.

Student Questions

In my opinion, the survey question that asks students to share any remaining questions they have is one of the richest sources of data we have. I picked up on three common themes when reading through student responses.

Straightforward answers

Students want specific numbers when it comes to finding sources for their research papers. Some examples of the kinds of questions include:

  • How many years is too old for an article?
  • How many sources is too many (or too few)?
  • What time length is necessary to commit to doing the research portion of the paper?

Value judgments

Students want librarians to tell them the difference between “good” and “bad” when it comes to their research. Examples of these questions include:

  • How do I tell if a source is bad?
  • How do I tell if I have a good topic / thesis / article / database?
  • Why are databases better than the internet?
  • Is it okay to [fill in the blank with various research practices]?

Genuine curiosity

For the most part, students took these evaluations seriously, and answered sincerely (though there were occasional humorous answers – this blog post’s title being one of them). In addition to reflecting on what they had learned, students demonstrated interest in the library beyond what we covered in the workshops. Examples of these questions:

  • How many types of librarians are there?
  • Do we use the dewey decimal system?
  • How many books can we take out?
  • Are librarians available on the weekends?

Conclusions

It’s difficult to immediately apply these results to our instruction practice (e.g., should we be giving students value judgments on source types? I think most of us would say no!). There are also definitely limitations to using a survey to assess student learning – we don’t get to see if students actually apply the skills they learn to their writing, and we can’t ask follow-up questions when we get a confusing response. But these evaluations represent an important part of the prism of student learning assessment that we do here at the Libraries. I hope that by sharing these results with teaching librarians, we’ve continued to shift our practice to meet changing student needs and to improve our instruction overall.

I look forward to continuing conversations with my colleagues about the following questions:

  • How might these survey responses help us improve our teaching?
  • How could we be using the data we have to demonstrate our impact?
  • What other data would be helpful? How might we gather it?
Posted in instruction and student learning, surveys | Tagged , | Leave a comment

Cookies, User Research, and an Iterative Design Process

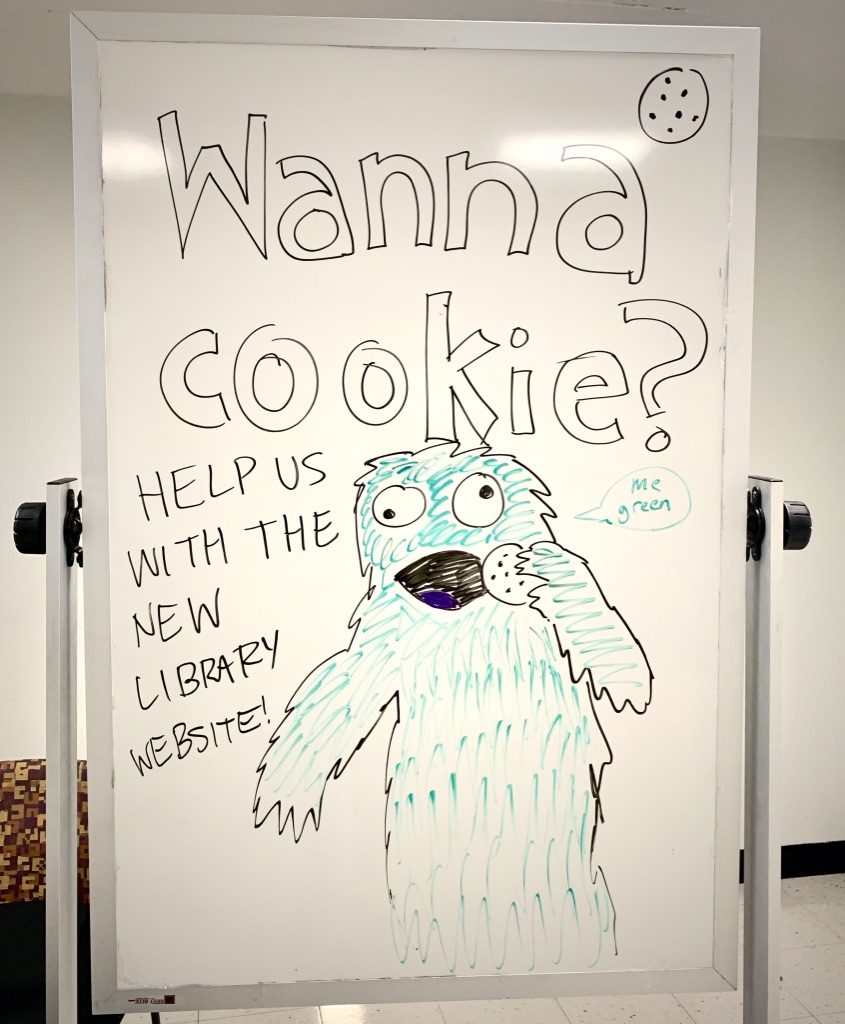
Cookie Monster invites you to help with the library website…

In late February, the Library Website Redesign project turned its focus to incorporating user research into the design process. With the help and support of Cynthia Schwarz, Nancy Turner, David Lacy, the UX group, and others, Rachel Cox and I began a month long “UX intensive.” The goal was to refine how content is organized on the site and to identify the primary site navigation.

During the UX intensive, we tested design prototypes with 48 users, recruiting passersby in the Paley lobby with cookies, granola bars, and coffee. The UX intensive also afforded us the opportunity to consider how to add user research and iterative design to the project on an on-going basis.

Organizing Content

When Rachel and I started our work, the site content was loosely organized based on the site’s backend infrastructure. The entity model allows us to group content into different entity types, such as services, policies, spaces, etc., and ultimately this model will make it easier for users to locate website content through search.

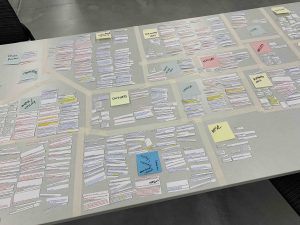
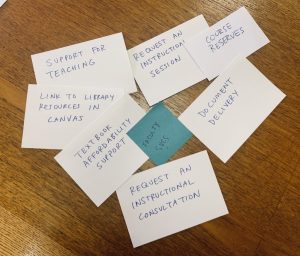
Cardsorting with library staff in 137

Our first step was to review the site content and organize it in a way that makes sense to users — we agreed that the organization of the front-end user interface shouldn’t necessarily mirror the backend entity structure. While the website’s infrastructure promotes discoverability of content, we didn’t think this was the most intuitive structure for navigating the site. Plus, we wanted to offer users a way to discover our content through browsing, in addition to searching.

Building on user research from earlier in the winter on the categorization of library services content, we did a holistic review of all of our site content. With the help of library staff we spent a day and a half in room 137, sorting our content into categories. We also spent time brainstorming category labels that accurately described the content within and were free of library jargon. Based on the card sort, we created two sets of content groupings, one a more “traditional” (and minimal) navigation similar to many other academic library websites, and an “action-oriented” navigation based on what users can do on our site.

Testing the Navigation with Users & Library Staff

The UX group then conducted tree testing with users on the two navigation menus.

screenshot of navigation menu

“Traditional” navigation

Ultimately, the “traditional” navigation tested better. Users were able to locate information with less effort and some commented that they liked the simplicity of fewer navigation options.

screenshot of navigation menu

“Action-oriented” navigation

However, one category from the action-oriented menu, “Visit & Study” was very successful. We went back to the drawing board, creating a single navigation menu comprised of the best elements of each.

We also asked interview questions to get a sense of what users expected to find in each of the category and whether the terminology we chose made sense.

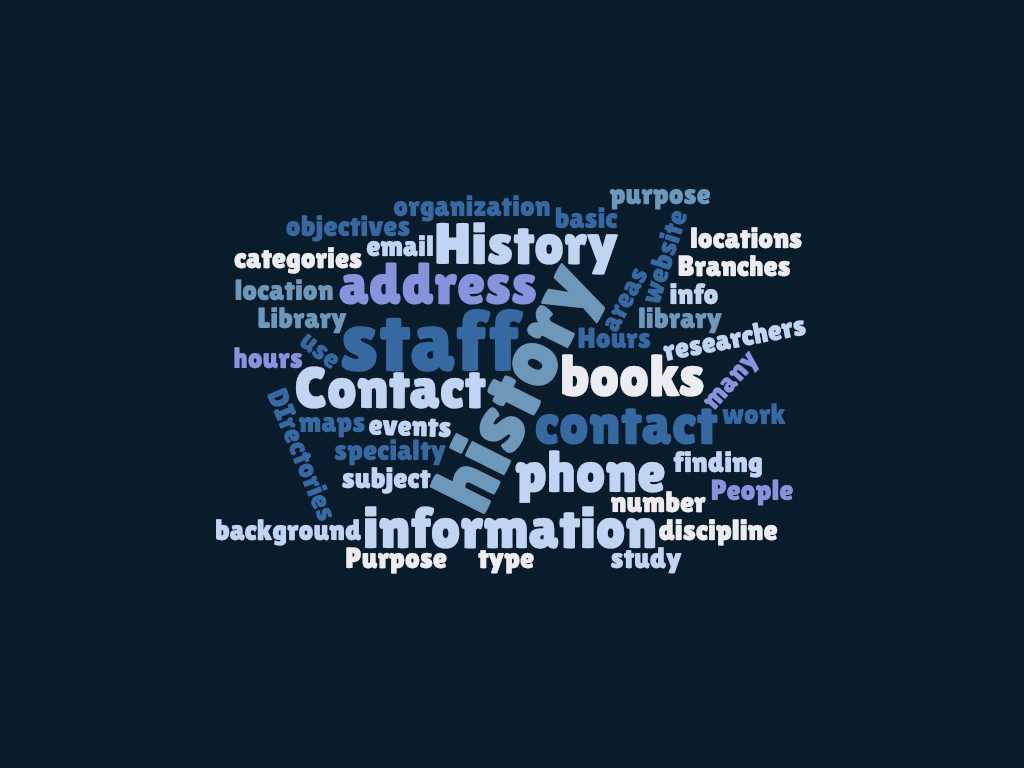
word cloud of what users expect to find in the About category

What users expect to find under About

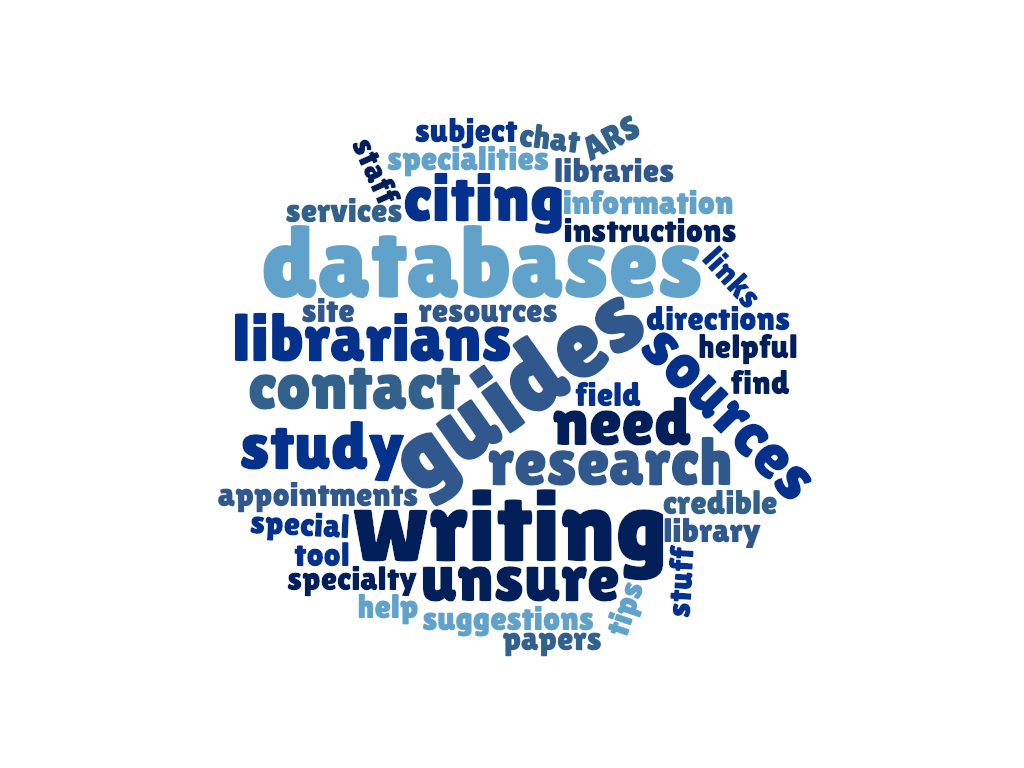
What users expect to find under Research

What users expect to find under Research

Refining Content Categories

From there, we continued refining the content and categories of content within the top-level navigation categories, i.e., we decided what site content should go under “About” “Visit & Study” “Services” and “Research.”

At this point, we realized we needed to meet with internal stakeholders. There was a lot of content about library services that we simply weren’t familiar with. We met with library staff from the Research Data Services Strategic Steering Team, the Scholarly Communication Strategic Steering Team, and the Digital Scholarship Center to learn more about their emerging services.

We shared the revised wireframes with library staff at an open forum in February where attendees gave feedback about labels, navigation, and organization of content. This feedback helped us to finalize the architecture of the site.

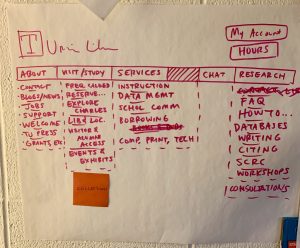
An early attempt at finalizing the navigation and content categories 

Building a Site Prototype

Once the site structure was finalized, Rachel created landing pages to correspond with the primary navigation, i.e. the pages where a user ends up after clicking a top-level navigation category. We used Balsamiq to design low-fidelity prototypes (or wireframes). Balsamiq allowed us to create interactive, clickable, prototypes that could be shared and tested with users.

The first landing page prototype was fairly bare bones; we listed content as text within each category. 

In the first round of user testing, we observed that participants spent a lot of time scanning the landing pages for the information they needed. Participants found the pages overwhelming and overlooked content in the categories. Some of the subcategory labels were also confusing. For instance, participants didn’t realize that “Libraries and Collections” meant Temple’s libraries and collections.

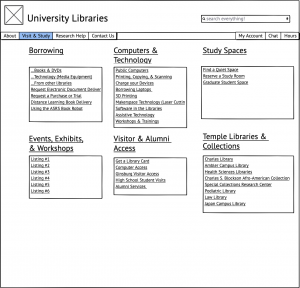
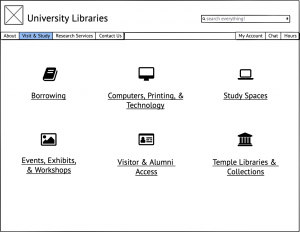
Based on results, we revised some of the terminology (e.g. “Libraries and Collections” was renamed “Temple Libraries & Collections”) and reorganized some of the content, but the biggest change was the elimination of the subcategory links from the landing pages. We designed icon-based prototypes of the landing pages hoping the icons would make the pages easier to scan. We tested the icon-based design with users just two days later with great success.

screenshot of landing page

Icon-based landing page

Since February, we’ve continued to make user research a routine part of the design process. Earlier in the website redesign project, design concepts often went from a basic prototype to final product with minimal staff or user input in between. Testing initial prototypes with users and library staff helped us to identify usability issues and iterate on the design before it moved to the final coding and review stage.

Today the UX group ran our last user research session in the lobby of Paley before the Library closes on May 9th. I look forward to continuing user research in Charles Library (as well as other campus locations) and integrating user experience into a variety of projects.

Posted in usability | Tagged , , | Comments Off on Cookies, User Research, and an Iterative Design Process

Strategic Steering Team: Just a Fancy Word for Committee?

I promised a “provocative” discussion at yesterday’s Assessment Community of Practice gathering, and I think we met that goal. The attendance was good, at least, with 27 staff members from  across the library (13 departments represented). A few highlights and editorial comments:

Impact

We often talk of impact as a way of measuring success as we work towards our goals. Impact can be a tricky thing to measure, and a single project may have different impacts, depending on the audience. Take our Open Access initiatives: From the student, or institutional perspective, impact for the open access textbook project is the dollar amount saved students. From the Library’s perspective, the impact is how open access ideas are advanced among Temple faculty. The Research Data Services’ data grants program is another example. We can count the number of applications received  for the first year.  That’s one measure. But we must also consider the increased awareness among faculty of the new ways in which the Library provides resources for their research. Harder to measure, but equally important.

Team Operations

The Strategic Steering Teams set goals and assess those, but also consider how the team functions as an organizational structure. To get those conversations going, leads  periodically ask of the team:  

  • How do you feel things are going?
  • Are you doing too much or not enough?
  • What changes would you like to see?

As a result, teams decide together how often to meet, and what the nature of their work together should look like.  We learned that each team has evolved in its own way, from serving as an advisory body to carrying out projects with “all hands on deck”. 

“What makes a strategic steering team any different than a committee?”

Merely being a cross-functional group is not enough. Focusing effort on areas of strategic importance happens elsewhere as well (thinking of the Web work now). In my mind, the autonomous nature of the teams is important. Each team begins its formative work by writing a charge – that process of creating a shared vision for the purpose of the team is one that is designed to bring the group together. It’s based on research : environmental scans both internal (where do we need to go?) and external (what are other libraries doing in this area?)  Team members are asked to think holistically when setting goals and to consider impact when prioritizing those goals. We take the concept of Team to heart,  sharing with team participants the seminal article, The Discipline of Teams as well as other resources for building teams.

We celebrate the collaborative, creative work that the teams are doing across the organization.  Scholarly Communication met with Collections Strategy to talk open access. Research Data Services also collaborated with Collections on their data purchase initiative. Outreach & Communication’s popular Ask Me Anything on Slack program serves the entire library/press.  The youngest team, Learning & Student Success, includes a member from the Writing Center, bringing a fresh perspective to that work. I think the idea of continuous reflection on our own structures is important. And while all of these elements are present in the group work we do across the organization, the Strategic Steering teams help to focus energies in a directed, yet flexible way towards library/press wide strategic goals. 

But there are clear challenges

Membership is a big one. How do we retain cohesion within the team but allow for fresh voices? How do we open up this kind of participation to staff at all levels? How do we resource the teams with dedicated staff time and potential dollars? How might we empower teams with more decision making authority in their areas of expertise?  

The meeting was open to all staff.  An open meeting that surfaces challenges to an organizational structure, I believe, is pretty special. Messy, yes, but an opportunity to learn as well.  Thanks must go to the Strategic Team leaders, to the many team members, and all who joined us for the session. 

Posted in organization culture and assessment | Tagged , | Leave a comment

Brainstorming New Metrics as We Transition to Charles Library

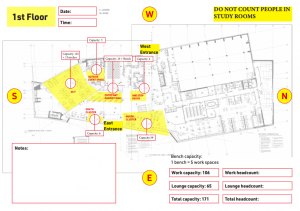
In less than six months we will be moving into Charles Library, an environment that will transform how we think about libraries and the resources and services it provides. And how we provide access to those resources and services. In preparation, staff members from 7 departments & teams gathered to start brainstorming questions we’ll be asking about how the Library serves its community. What metrics will we use to best demonstrate the impact and value of the Library for Temple University, its neighborhoods, and the world?


Capturing our Brainstorming


We started with a reflective exercise, and asked ourselves these questions:

  • In the area of your own current operational work, what will you want to measure and track as you transition to the Charles Library?
  • What will be one important thing to measure as we demonstrate the library’s value and impact to the University?

The reflections generated lots of important, and creative questions – summarized here and included in the “rough” below.   Some questions are more straightforward than others.  As we determined, it’s easy to count, but numbers never do full justice to the real changes we’ll be seeing.  And sometimes, smaller numbers do not mean less impact.

Connections to People

  • How will reference interactions (basic, consultations) change, both in terms of  quantity and quality
  • How are students connecting with research librarians or other subject experts for research support?
  • With the different styles of instruction space (traditional hands-on computer lab and more flexibly configured spaces), might we compare the effectiveness of instruction in each?
  • Instruction numbers going down might actual equate with great impact. How do we know? If we implement new approaches, like training of faculty or online programming – we’d have more “reach” but numbers wouldn’t reflect that.
  • Is our new programming space attracting new people?  Our dedicated exhibition space will allow us to measure audiences more accurately, and we can start asking visitors if they are a first time attendee.
  • Is social media engagement going up?

Space Use

  • Are more patrons coming into the building? Where do they go?
  • How are the various space types being used by students, graduate students and faculty?Do these new space types and technology offerings changing the perception of the library as a space primarily for undergraduates?
  • How will the new meeting spaces provide opportunities for new types of workshops, for instance, on sensitivity and conflict resolution. These would be useful for guests as well as for Temple community.
  • In the opinion of our users, are we providing a better overall space/facility than Paley? This would be hard to measure, but we might compare perceptions of first year students with more senior ones.

Access to and Use of Collections

  • How will the ASRS be used? Will circulation go up or go down? Will patrons request books for pickup later? How many books will be requested at one time, and will those all get checked out?

Technology Use:

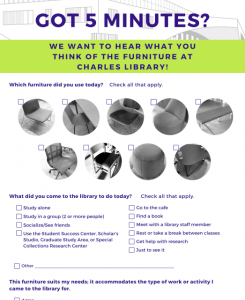
  • How will the laptops available for check out be used and by whom? What is the duration of use? What types of equipment are the most popular?
  • Will the increased visibility of the Scholars Studio affect how technology available there gets used? Will it attract new users, like undergraduates? If technology tools like 3-D printers, are offered elsewhere on campus, how does use of the Scholars Studio compare to those other locations?
  • Are users satisfied with the technology offerings?

Web Use

  • Since physical access is limited, how are users discovering physical library materials in Library Search?
  • Are people accessing our publications via the website?

New Services and Equipment

  • Can we demonstrate increased affordability? Does availability of equipment mean students don’t have to buy it, lowering the cost of attending Temple. This would include equipment such as laptops, cameras and specialized software.
  • How will we take advantage of new potential for collaborations with the Writing Center and community organizations. How can we measure goals from our case statement, such as “Advancing student success through co-location of CLASS and Writing Center?”
  • What are the best ways to share library stories?  


Posted in statistics | Tagged , | Comments Off on Brainstorming New Metrics as We Transition to Charles Library

Agile as Assessment: Driving in the Dark but Knowing Where You’re Going


Cynthia Schwarz, with Dave Lacy and all the staff in LTS/LTD have put into operation a robust set of tools for communicating, documenting, and tracking workflows for all the complex work going on at the Libraries – technology-based and beyond. I think there is a relationship between these tools and principles associated with assessment and organizational development:

  • transparency
  • continuous improvement
  • frequent iteration
  • teams with diverse expertise

So last week I sat down with Cynthia to talk more about how Agile and assessment are connected.

NBT: You’ve really mastered the principles of Agile for project management in the last couple years. I know that the whole Library Technology/Knowledge Management area is proficient in using Agile tools – and we are all learning more about how best to use those to communicate and share information. But there are additional aspects to Agile principles that relate to organizational values and assessment – and I’d like to ask you about those as well.

NBT: In a nutshell, can you tell me what Agile means, and why it’s been adopted for managing technology projects here at the Libraries/Press?

CS: Continuous improvement is one term; also flexibility is another term that I’d use to describe Agile. Here is an analogy that helps to explain how Agile works.

Imagine that you are taking a trip at night. You set your destination on your car’s GPS. That provides you with the estimated time of arrival, and the route you will take. But it’s dark and there is only just so much you can see in front of you. And you have to be prepared for unforeseen challenges. In Agile, we know what our outcome needs to be, and we know how much time we have to get there. But we need to stay adaptable and flexible, because there may be unexpected barriers on our path.

Compared to the website development project, Alma was very straightforward.  Ex Libris provided a clear, defined script for the implementation. With the website, we need to stay much more flexible and in some cases, create our own path forward. Because we aren’t using a traditional CMS. We have identified an end goal – to demonstrate what the Libraries are to the community, but there are a hundred ways of getting there. Changing course is inevitable, so being adaptable as we go is essential to success.

NBT: There are many areas of Agile that relate to assessment and organizational effectiveness. For instance, transparency and communication. That’s something we’re seeing more of.

CS: Transparency and communication are not necessarily part of Agile, but definitely part of the operating principles for LTD/LTS and part of the JIRA and Confluence tools that support working together in an Agile environment.  

We know we need to document. This provides us insight into what we do. It also allows staff from outside the projects to come into our space. They may not know too much about what we do, how we spend our time, but this makes it easy for people to read about it, to learn and provide feedback.  

NBT: Yes, that and Slack really open up new doors for us all. Sometimes when I go to the Developers  Slack channel it’s like they’re speaking a foreign language. All those references to Honeybadger!

CS: Yes, and it is another way that we are continuously improving on our work and connecting with stakeholders.  We try to maintain frequent back-and-forth with stakeholders.

JIRA has been particularly useful for this. Here’s a good example: The website’s Events & Exhibits page. Rachel mocked up the page. Chris Doyle coded it. Throughout the process, Sara Wilson was able to provide input.  It’s just a matter of “tagging” someone in the comments, and they can provide feedback immediately.

NBT: What do you like about living in an Agile world?

It’s exciting to actually do Agile – a lot of organizations claim to do it ; but we are fairly Agile as a development team.  It gives structure to projects. It requires us to think through the various elements when a project is initiated, so we don’t take on more than we can “chew” – work wise.

NBT: Yes, and it seems as though with the increased communication and visibility, and the flexibility that the approach allows for, and the inclusion of stakeholders every step of the way – you’ve opened yourself up to continuously reflecting on and improving your processes. If we think of assessment in those terms, you are definitely modeling it.

Thanks, Cynthia.


Posted in organization culture and assessment | Tagged , , | Leave a comment

A Critical Approach to Library Assessment and User Experience?

As the new year begins, I’ve been reflecting on the exciting changes 2019 will bring to both our physical and online spaces. Projects that previously felt distant or nebulous for some of us, like the creation of a new library website or move to Charles Library, are now fast-approaching. As we consider how to design and assess the user experience of our changing web presence and physical spaces, much of what I learned at last month’s Library Assessment Conference feels well-timed.

The sessions on user experience offered practical insights on methods and tools that can bring user feedback into digital projects like the website redesign and Library Search. Amy Deschenes (Harvard University) described her library’s website redesign project from start to finish including early discovery research (user interviews) and the creation of personas that informed decisions used throughout the entirety of the design process. Her explanation of integrating UX into agile sprints with technology staff felt particularly germane to our own technology development environment. Zoe Chao (Penn State University) made a persuasive case for using comparative analysis to test website navigational structures, and Andrew Darby and Kineret Ben-Knaan (University of Miami) shared online usability tools that make it fast and easy to conduct remote testing of webpage prototypes and site architecture with large numbers of participants. In the pre-conference workshop I attended, Kim Duckett and Joan Lippincott shared strategies and examples of post-occupancy space assessments for understanding the effectiveness of spaces for students, such as learning commons and digital technology spaces.

The presentation I keep coming back to, though, is one that questioned the emphasis on “practical” conference takeaways and argued for a more critically reflective approach to assessment and user experience work. In “A Consideration of Power Structures (and the Tension They Create) in Library Assessment Activities,” presenters, Ebony Magnus (Southern Alberta Institute of Technology), Jackie Belanger and Maggie Faber (University of Washington), highlighted the pervasiveness of the “practical” in librarianship, pointing to how often we create “how to’s” and “best practices” that are intended to make work easier and efficient. In the library assessment world the focus is often on specific tools and research methods. The presenters argued not that learning the practical— best practices, tools, and methods— has no value, but that we look at our assessment approaches through a “lens focused on power and equity.” Doing so allows us to interrogate how our own positions of power shape the assessment work we do.

We might, for instance, look critically at how we prioritize projects, the questions we ask, how we recruit participants, the research methods we use, and so on. During the presentation, I reflected on how we recruit participants for impromptu or “guerrilla style” usability testing of our website. The advantage to this type of recruitment is that it’s easy and convenient, but we’re missing feedback from populations who do not physically visit the library. Questioning our assessment approaches in this way can guide us towards a more inclusive assessment practice that benefits all users, particularly traditionally underrepresented groups. In a related blog post, the presenters outline additional strategies for incorporating more inclusive methods into assessment practice.

My favorite conference experiences are those where what I learn feels useful. I want to leave a conference with practical ideas that are easily adaptable in my own institutional context. I’m eager to attend any session that promises attendees a concrete takeaway to the point of skimming program schedules for phrases like “attendees will learn methods, tools, or strategies to use at their own institution.” The Library Assessment Conference didn’t disappoint in this regard.

The website redesign and the move to Charles Library will significantly impact library users and library staff, and now is the time to plan for how we will design and assess the user experience of both. I hope to see us engage in the critical approaches, because those are the ones that will allow us to work towards the best user experience across our student populations.

Finally, I encourage everyone to have a look at Magnus, Belanger, and Faber’s beautifully written post, Towards a Critical Assessment Practice,” in In the Library with The Lead Pipe which provides more detail about critical assessment practices.

Posted in conference reports | Tagged , , | Leave a comment

Avoiding New Year’s Resolutions, or Not

Image from en.wikipedia.org

I may be turning cynical, but I’ve stopped making personal New Year’s resolutions. The U.S. News & World Report says that 80% of resolutions fail by February. That’s depressing!

While there may be a rational, statistically valid reason for not making resolutions, that is probably not the whole reason. I think we resist making resolutions for emotional reasons as well.  We fear we won’t keep them, and that will feel like a failure. If we don’t succeed in those goals, we just don’t “measure up.”

How does this relate to library assessment? Good assessment, or continuous improvement, is grounded in setting a goal or benchmark of some sort. Goals help us to imagine a vision of the future that is better.  And if we set that goal, with a measure, then we may not make it.  So why articulate what success looks like when we may not measure up?

Sometimes I  fear that when I talk enthusiastically about creating a culture of assessment here at the libraries/press, about setting departmental goals and developing assessment plans, I don’t feel much love. We hear assessment and that equates to evaluation – to good and bad. 

No one wants to be judged. Or to set a goal that isn’t attainable. Perhaps we set those goals low, somewhat timidly, and we certainly don’t shout about them in a public space.

So this year I will do what I ask others to do – I set, and publicized (on Confluence), goals for Organizational Research & Strategy Alignment for the upcoming year.  They look like this right now:

  • Assess the effectiveness of strategic steering team model for enhancing innovative, collaborative, cross-functional team-based  work across the libraries system and its communities.
  • Establish structure for Data Task Force and develop scope/groups to look at:
    • Data Collection
    • Data Privacy
    • Data Identification
    • Access and Communication
    • Learning Analytics/Integration with central ITS
    • Analysis / Platforms
    • Storage
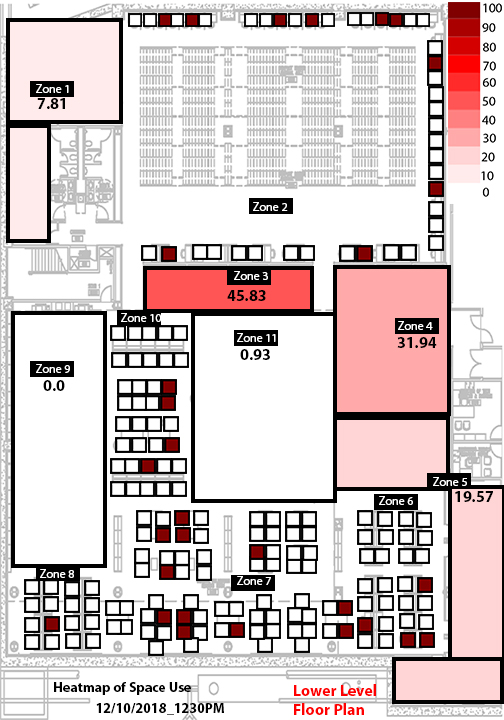
  • Develop plan for assessment of space use in Charles Library, making sure that data gathering systems are in place to demonstrate use and value of new types of spaces for learning and engagement.
  • Work with team leads/department heads to develop assessment approach for key goals established for FY18-19.
  • Embed user experience research methods into development of services at libraries, to include website and discovery systems.

These are not too ambitious, but I think fit well within the library’s strategic directions and align with my own vision for the libraries as a learning organization.  And yes, I’m exposing myself to “not measuring up.”

But here’s the thing. I can only achieve the goals by sharing them with my colleagues. Getting feedback. Getting support. Learning from others’ expertise. Like the runner who has a partner to help get going in the morning, or the smoking quitter who relies on a friend when longing for a cigarette – we all feel more motivated when we share goals and get some support towards achieving them.  Working collaboratively to meet our aspirations gives us a MUCH better chance of success.

So my real resolution is to work with you all this year to bring assessment more to the forefront of our work. Not as a way of setting ourselves up for failure, but by better articulating, together, our vision for what matters to the organization and what “better” might look like.


Posted in organization culture and assessment | Tagged , | 1 Comment

Library Space and Pot Plants: An Unexpected Connection

“Fall in love with your users” – Paul-Jervis Heath

When Paul-Jervis Heath told the story of how pot plants improved occupancy rates at the Cambridge University libraries, the non-Brits at last week’s Library Assessment Conference were a bit confused. We would describe these as “potted plants.” We all laughed, then Heath went on with his story:  In testing various seating arrangements in the library’s reading room, the design team learned that plants placed in the center of each table provided a psychological sense of privacy, and students were more likely to sit across from one another while studying when plants were used as dividers. The designers learned that occupancy was less dependent on the number of seats in the space than how those  seats were configured in relation to one another.

Small round tables created personal “bubbles” and resulted in one person sitting alone at a four-top, leaving 3 seats empty. Low-backed couches arranged like train cars left patrons feeling as if someone might be watching them from behind, or reading over their shoulder. This seating type also reduced occupancy.   These  findings were discovered as part of the prototyping process. The designers experimented with “cheap” Ikea furniture that allowed for iteration and experimentation – prior to investments in permanent furnishings.

Heath is the founding principal of Modern Human , a UK design and innovation consultancy. His work with all kinds of clients provided a refreshing perspective on service and space strategy for the 600 librarians attending the conference last week in Houston. His presentation related to the use of ethnographic methods in design towards prototyping services and spaces in libraries.  

Design ethnography is a tool that many of us use in our assessment practice. Its roots are in anthropology and Nancy Fried Foster, then at the University of Rochester, popularized its approach in the now classic Studying Students. Observation, diaries, journey maps, design charrettes – the methods strive to understand users not by asking them what they want, or studying historical data – but by watching, and observing the kinds of barriers and frustrations users experience as they do their work. The approach can be used to understand how users search for an item in the library catalog, schedule a study room, or interact with a service professional. The idea is that by watching people, by observing in unobtrusive ways, we learn what motivates people, what’s important to them and what they value. 

Heath emphasizes the power of iterative design and prototyping. It’s important to “Keep everything you design as an experiment.” – not getting too attached to a single solution before you’ve tested it with users. As much research in assessment shows, librarians and other information professionals may have quite different mental models of the information universe than our users.  Heath provided us with powerful examples of resolving this challenge.   

Next post, Jackie Sipes (User Experience Librarian) will share her takeaways from the conference!

Enjoy,

https://speakerdeck.com/pauljervisheath/unlocking-the-power-of-design-in-libraries


Posted in conference reports, library spaces, qualitative research | Tagged , | Leave a comment

Mapping Library Goals to Institutional Priorities: An Assessment Workshop

Last week two dozen library staff members took time out of busy schedules to participate in the Assessment Community of Practice. The session was structured a little differently (always experimenting here!) with small round tables, mixed department seating, and facilitators at each table (thanks, Steven Bell, Olivia Castello, Lauri Fennell, Cynthia Schwarz, and Jackie Sipes). The facilitators did a great job of encouraging participation from everyone, bring together the rich kind discussion that cross-functional groups can bring to bear on a challenge. 

While we started with a discussion of the article Demonstrating Library Value through Outreach Goals and Assessment from Educause, the purpose was to find connections between our library/press goals and strategic actions with Temple’s Institutional Priorities. And considering the kinds of assessment that would demonstrate progress towards those goals. This outcome will keep us on track as the University prepares for the upcoming Middle States accreditation, a process that  compels us to articulate how the library supports institutional values, assesses that work, and puts into place changes based on findings.

Temple Institutional Priorities

Each table was tasked with addressing these questions:

Of the ideas presented in this article, what resonated with you the most, particularly in thinking about how you present your own work or the work of your department?

Table Brainstorm: How does the work that you or your department does have an impact on users (student success, faculty productivity, community services). What does success look like?

Select a goal from the Strategic Directions document. How might you assess that goal in terms of impact? Consider both the library’s interests, and those of external stakeholders.

Discuss your ideas with table mates.

These discussions  yielded good ideas on a wide range of services provided by the library, from our affordable laptop borrowing program to the assessment of a program to promote diverse materials in our collections.

  • Table 1 looked at the departmental goal of “Providing fast easy access to laptops and scale up to meet demand” and suggested a learning outcome for this goal: Students can identify library as a laptop source and can obtain a laptop in a totally self-service mode. To access this, we might look at the statistics or deploy point-of-survey surveys (on IPads?) and conduct observations as students interact with the service.  
  • Table 2 discussed how outreach efforts, for instance events like Beyond the Page, map to the curriculum. How can we best engage with faculty as these events are planned, and assessed? From their perspective, does attendance at a program make a difference in the quality of their work?
  • Table 3 discussed how the library might demonstrate its commitment to diversity through displays of heritage content. We might look at who we buy from (minority/women owned businesses)
  • Table 4 recognized that the article did not provide an adequate definition of outreach, and the much of the library’s efforts, like open textbooks, relies on services provided throughout the library.

This last is important — outreach, demonstrating value, connecting to Institutional Priorities – these might be considerations for all of us. To that end, I’d like to put this challenge out to library staff from all levels of the organization:  Select one of your articulated goals for FY18-19. Considering how you will demonstrate value and impact. How will you assess the success of this initiative? 

Posted in organization culture and assessment, process improvement | Tagged , , , , , | Leave a comment