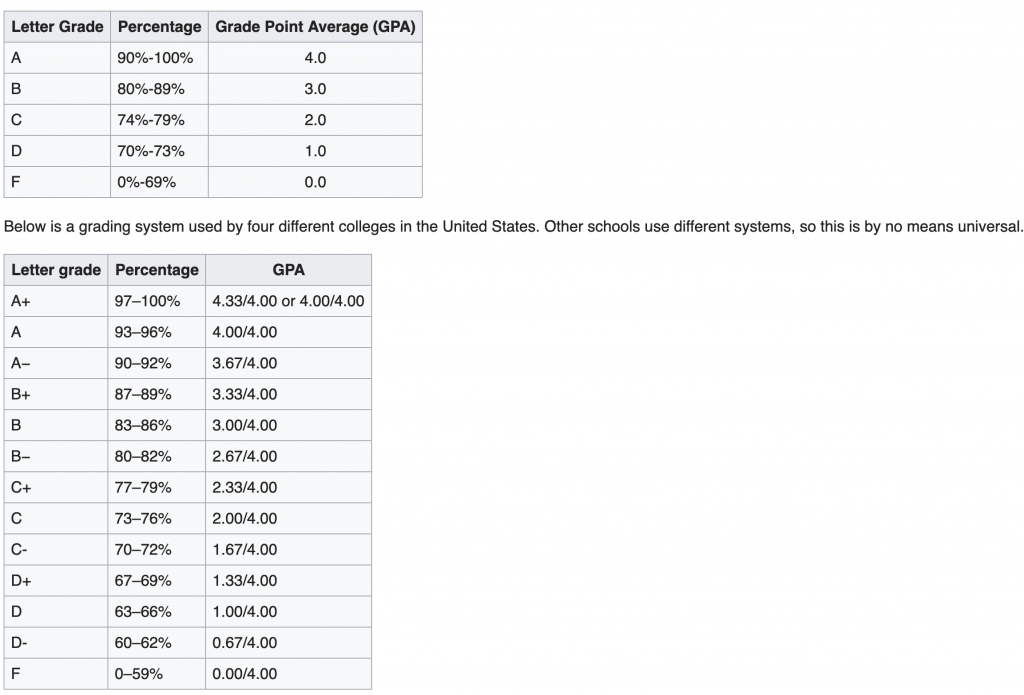
When you think about it, the most common grading scheme used at American colleges and universities doesn’t make a lot of sense. On a 4.0 grade scale a C is worth 2.0 points, a C+ is 2.33, a B- is 2.67 and so on… Each grade spans a range of 0.33.
Except the A. Typically an A spans 3.33-4.0, twice the range of other grades.
Wikipedia shows the following tables in explaining the grading scales for American colleges and universities.
Although I’ve never seen a formal survey, in 20 years of looking a transcripts I’ve found that the vast majority of institutions have dropped the A+. There are exceptions. At the University of Pennsylvania’s Wharton School of Business “A+’s are allowed but still carry a 4.0 point value.” Really? What is the point of having A and A+ grades if they are numerically equivalent? Just put a gold star on the student’s paper.
More logically, Cornell University assigns a value of 4.3 to a grade of A+, which maintains a uniform step of 0.33 for each grade increment, but a grade scale that ranges from 0-4.3 puts Cornell out of step with nearly everyone else. I’m sure graduate institutions considering applicants from Cornell simply renormalize student GPAs to a 4.0 scale.
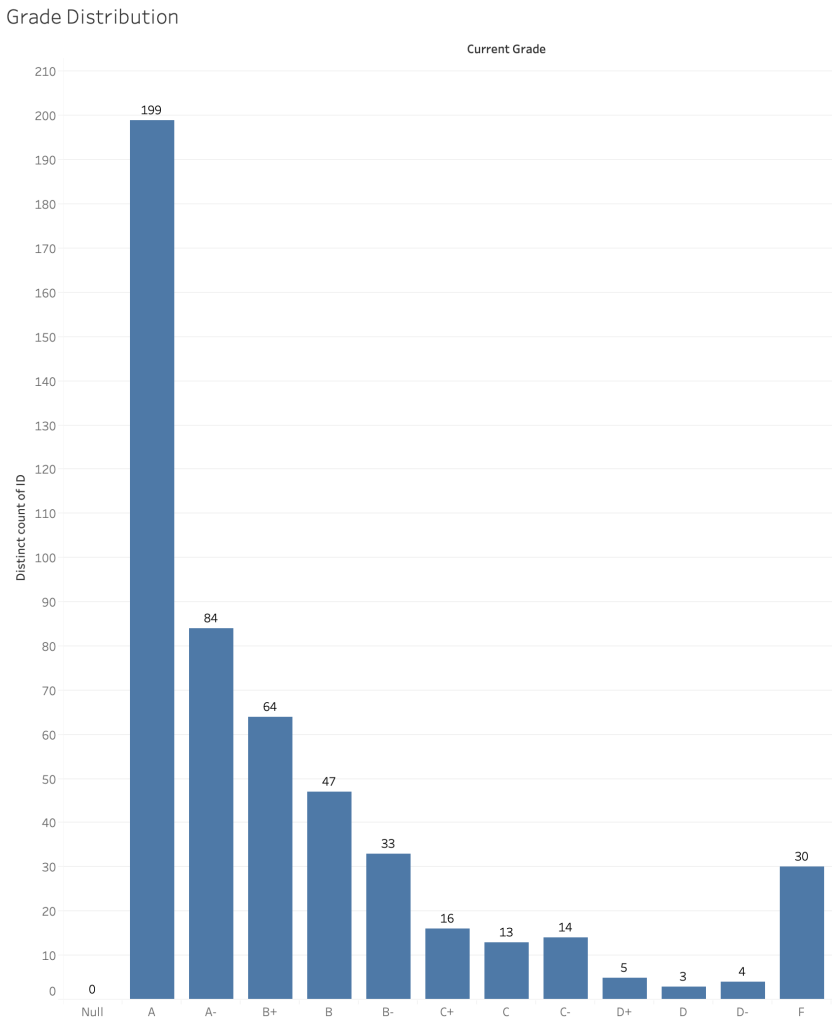
Temple University follows the standard practice of mapping 93-100 to an A. This compounds the problem of grade inflation. The graph below shows a typical grade distribution of all students taking any section of a particular class in Fall 2018. Apart for the sad truth the A’s have become the most common grade, fewer than half as many students received A- than received an A, in part because the A and A+ are lumped together.
What is probably the most illogical element of our college grading scheme is that we often give numerical scores on our assignments, convert numerical grades into categorical data when assigning grades at the end of the semester, then treat the categorical data as numerical when calculating a GPA .
But that is a story for another day…


