
While Temple make it easy to create a WordPress hosted website, they turn off all user-authored javascript. I guess they have a point; security is a huge issue as hacker assault our servers all the time. But if you want to post cool interactive graphics to your website, what’s a poor scientist to do?
Enter Plot.ly….. Okay, so I can’t embed the actual plot in WordPress, but I can do the next best thing. I can embed a static image with a link to the dynamic plot hosted for free on the Plot.ly website. Click on the image below and try zooming and panning around. Cool!

A Plot.ly Example
That was nice, but now let’s get fancy and show a radargram with the traces. All interactive!
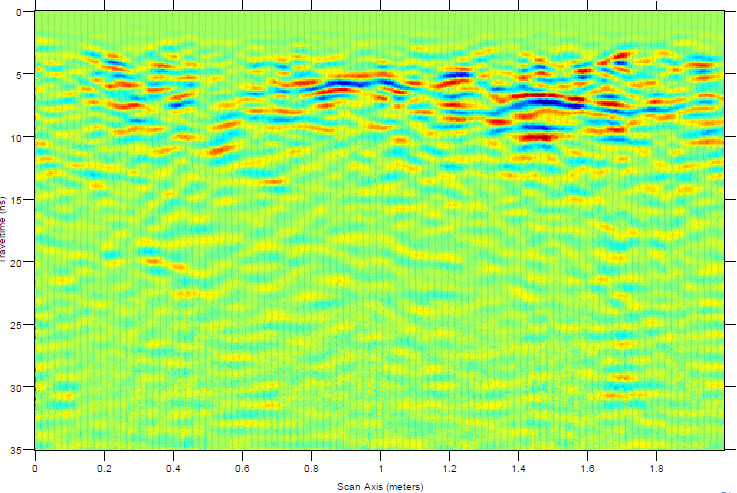
CZO Radargram