Cynthia Schwarz explores the use of technology in libraries

Cynthia Schwarz is the Senior Systems & Technology Librarian at the Health Sciences Library. She recently moved into this position after 6 years on the Main Campus. In both these jobs,  Cynthia has used her technical expertise to address questions about how students use technology and how we can optimize our offerings to support their work. She sat down with Nancy Turner, Assessment Librarian, to talk about her “investigations”.

NT: So what were the questions that you had?

CS: Here at the Health Sciences Library we have several public Mac computers that are located in the open stairway area – this is a pretty high traffic area and yet they didn’t seem to be getting a lot of use. As we make decisions about investing in new computer workstations, I wanted to have more data about how frequently the different computers in the Library were being used, what types were preferred, who was using them, and what software was being used.

NT: So how did you go about gathering this information?

CS: The timing was good, because we now have access to an analytics tool called LabStats. The TECH Center has been using this tool for a while to learn about what’s going on there. We combine data from LabStats with data from our student database, Banner, so that we can get the department and status of the patrons that use our computers.

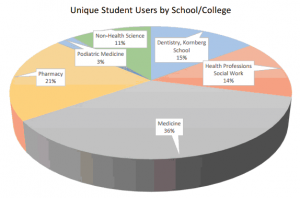
Use of Computers by Student School/College

I have a map of where each workstation is located in the Library and each computer has a unique name. I can see how many times that workstation was logged into, how many unique users, what time and days. I collected the use data for the Spring semester. There is a separate report for what type of software is used but that’s a little more difficult to manage. It takes time to run the reports and it’s not as accurate, or it would take more time to analyze it. It’s based on the name of the application.

NT: What did you learn?

CS: Well, the data showed that these Mac computers do indeed get used. I was also surprised by the relatively high use of our computers by students in schools outside of the health sciences. And there were a relatively high number of alumni are using the computers.

NT: Why do you think that is?

CS: My theory is that the Library is quiet and it’s a pleasant place to work. We don’t limit who uses the library space to only health science students. So students who live nearby, or who are taking a class outside their major, or maybe students with jobs nearby can come and use our library.

NT: Any next steps?

CS: My goal is to monitor computer use through next year. We want to understand if there are preferences for MACs over PC’s. And using the Millennium reporting capabilities, we can run reports on the use of other types of technology: laptops, iPads, remote controls and keys to the group study rooms. For instance, we’ve got 65 laptops available for borrowing. I’d like to explore how frequently these get used. This information will help us to make decisions about future investments in technology here at the Library.


Posted in data-driven decision making, technology use | Leave a comment

Temple University Libraries Overhead Survey Enters Its 4th Month

Temple Library staff members may have noticed yellow paper surveys floating about the building or seen Jim Bongiovanni’s e-mail messages about the web survey launched each month for users of proxied library resources. These are part of the “Overhead” or Cost Analysis Survey. We will be conducting the survey at random hours in Paley, Science and Engineering, and Ginsburg Health Sciences Library through June 2015. The survey is designed to establish a percentage of library costs that support “sponsored” research – for instance grants from the National Science Foundation or the National Institute of Health.

In the first three months, we’ve distributed 1620 surveys and had over 800 returned. And although it’s too early to have truly representative results, I’d like to share some user data gathered so far, with the caveat that only at the end of June will we have a full picture.

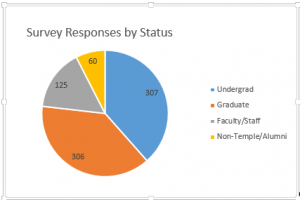
The responses are evenly split between Undergraduate and Graduate students, but we have a good number from faculty, staff and community members as well. overhead graph 1

Each of the libraries serves a different mix of patron types. Paley serves undergraduates primarily (58% of Paley responses are from undergraduates), and HSL serves graduate students (44%). SEL patrons are primarily undergraduates from the School of Engineering. And where are the faculty? They’re coming in from the Web. 74.4% of web responses were from faculty.

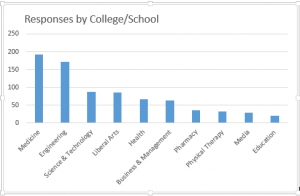
overhead graph 2

The chart above shows the top ten schools represented in the survey responses so far, but all the schools and colleges make use of the Libraries. Based on survey responses, HSL patrons are primarily students from Medicine, Podiatry, Pharmacy and Dentistry. And while mostly serving engineering students, SEL also supports students from Science and Technology and even Theatre. Paley has the widest “mix” of students.

The web surveys provide us with information about who’s using library resources, from where, and what resources those are. (This is anonymous data, of course). Of all patrons using online library resources (not including the catalog), 51% are off campus, 36.9% are on campus but not in the library, and 11.9% are actually in the library. That’s interesting, isn’t it? Perhaps an indication that students in the library space are here to work on papers, study, or attend a class – but not necessarily using the licensed resources. So far, the top databases and resources used via the Web are: PubMed, Refworks, PsycInfo, Academic Search Premier, JSTOR, and ISI’s Web of Knowledge.

These data are not too surprising, but as the year progresses, we’ll have more robust and interesting data. And I hope additional insights into use the the library and its resources.

I want to thank all of our students and staff who have helped out with the survey so far. They are: Tiffany Ellis and Lauri Fennel at HSL, Cody Smallwood at SEL, and from Paley, David Murray, Anthony Diamond, Lori Bradley, Jonathan LeBreton, and our invaluable students: Mariah Butler, DJ Daughtry, David Glover , Nadia Khatri, Roma Marcos, Kaitlin Mashack, and Steven Wei. Kate Lynch and Jim Bongiovanni have done a tremendous job with the web survey.

If you’d like to help out, please do let me know. There will be 9 more opportunities!

Posted in surveys | Tagged | Leave a comment

Survey of Teacher Education Faculty

Jackie Sipes is the Education Liaison and Emerging Technologies Librarian in Research and Instruction Services (Paley Library). Towards the end of the spring semester, Jackie conducted a survey of the faculty in the department of teacher education. Nancy Turner asked her about this assessment project.

NT: What were you trying to learn by conducting this assessment?

JS: I’ve been here for just under two years, and I wanted to learn more about the kinds of research-based assignments being used in the teacher education program. I felt like I hadn’t yet made inroads into the program, either with faculty and students. I wanted to find out about their needs in library instruction and student research support. This was also a way of letting faculty learn about me and what I can do for them. I also wanted to know about specific courses being taught that incorporated research assignments.

NT: How did you choose your assessment method?

JS: I chose to conduct a survey because it would reach the greatest number of faculty and could be brief and unobtrusive. I chose to focus just on faculty so that I could tailor the questions to get their impression of how they felt about their students’ skills in information literacy.

I was a little disappointed in the number of responses I got (9) but the information I gathered is very useful. Something is better than nothing!

NT: Right. You can’t necessarily generalize about all the faculty from these responses. So what did you learn from the feedback?

JS: Most of the respondents are aware of the library’s services, but they don’t feel they have time to incorporate a full-blown instruction session in their schedule. So I will be emphasizing to them the other ways I can connect with their classes and students, like a 5-minute “drop in.” While most of our instruction sessions teach students how to locate scholarly articles, I learned that teacher education students are often required to find other types of materials as well: lesson plans, curriculum documents, or general subject information with which they can build a lesson plan. So I’ll start incorporating those types of searches into my instruction. And I learned that there may be a different use of language in describing a research assignment. For instance, students might be required to do an assessment of a classroom intervention.

NT: Will you make any changes based on what you learned?

JS: Definitely. I’ll make sure that instructors know that I can come in for just a few minutes to introduce myself and be visible. I’ll focus my outreach efforts towards those classes that were identified as having a research component.

NT: If you did this process again, is there anything you’d do differently?

JS: I was pretty happy with the questions that I asked. It got me the information I was looking for. I think that I’ll try conducting the survey in the beginning of the semester next time. The survey could be part of my outreach e-mails where I let faculty know about what the library can do for them.

Posted in instruction and student learning | Tagged , | Leave a comment

David Murray’s Experience as an Embedded Librarian

David Murray (librarian for History, Latin America, Spanish & Portuguese) in the RIS department partnered with faculty member Ron Webb to teach The Legacy of Mesoamerica this spring. In this conversation with Assessment Librarian Nancy Turner, he describes his work as an “embedded librarian”, the assessment he conducted as part of that work, and considers the value of embedded librarians in contributing to student research success.


NT: Tell me about your project.

DM: I worked with Professor Webb for 9 to 12 months to put together a course and syllabus on The Legacy of Mesoamerica. The goal was to move beyond the imparting of ACRL’s standard for information literacy instruction, the so-called one-shot instruction session, and to instead embed information literacy into the curriculum. We went beyond the one-shot by having me, the librarian, convey or impart course content as well as those information literacy skills. We thought having the librarian deliver course content, in this case a series of lectures on Classic Maya art and architecture, would incline the students to take the information literacy component of the course more seriously.

There were three information literacy assignments within this course, and one “warm up” exercise that we can use as a “pre-test” of students’ skills. The primary assignment was an annotated bibliography, which was graded using a rubric provided to the students.

I had several questions.

  1. Are there indications of student learning, based on comparing the pre-test to the skills demonstrated in the annotated bibliography?
  2. Did the students feel that having a librarian in the classroom improved their understanding and skills with the research process?
  3. Did the improvements in student skills justify the time spent on the class and with the students?

For the first question I could compare the IL skills manifested in the “warm-up” assignment (pre-test) against those of the annotated bibliography. The two are not directly comparable, however, except in the sense that for both I asked students to describe the research process. In other words, the two assignments differ structurally. Yet I believe when properly compared can reflect changes in the students’ approach to finding, using, and evaluating information sources for academic work.

I used a survey to get at the second question. The survey was intended to measure perceptions and attitudes, not knowledge.

NT: Tell us about your results

DM: 7 out of 9 students responded to the survey. 2 were not in class that day.

The top three skills the students felt they learned were:

  • “Choosing the most appropriate method and tool for accessing information”
  • “Recognizing and employing “subject” searches in library databases and catalogs such as Diamond”
  • “Learning how to critically evaluate sources of information for college-level research”

Most students expressed some level of appreciation for having a librarian closely involved with the course. One student valued having a “second opinion” available on papers. Another stated, “… by seeing the librarian so much in class it created a closer relationship between him and the students that made it more likely to maintain communication,” an indication, perhaps, that at least one student perceives value in establishing a long-term connection with a librarian.

I used a rubric to grade the annotated bibliography. While rubrics are practical and help students to understand the expectations, I don’t want to have students just “parrot” back to me what they know I want to hear. I haven’t yet systematically compared the pre-test to the annotated bibliography, but a preliminary comparison suggests students learned to become more sophisticated in their approach to information. For example, one of the students – an excellent student, I might add – progressed significantly in her understanding of the use of primary and secondary sources in her research. Several students also demonstrated, pre- vs. post-test, a better understanding of which of the many library databases available to them would likely uncover the most relevant sources for their topics. Finally, I noticed that several students were able to demonstrate an improvement in their basic understanding of search syntax (or the way a search is expressed in the database).

NT: Is there anything you were surprised by?

DM: I was surprised that learning to use subject headings for searching was important to the students. Librarians debate the utility of teaching students what we, as insiders, refer to as “controlled vocabulary.” Reference and cataloging librarians know the importance of subject headings, but some in our field claim that students and other library patrons do not appreciate subject headings, and cannot learn to use them effectively. Given this internal debate, I was pleasantly surprised to discover that my students expressed an appreciation for learning how to recognize and employ subject headings and other controlled vocabulary. Strangely, only three students said they learned to understand “what constitutes plagiarism and acknowledging the use of sources through proper citation.” I say strange because we emphasized the importance of mastering American Anthropological Association (AAA)-style citation in class, in the course guide, and on the assignment prompts.

NT: What are your next steps?

Students appreciated both the help with research and the writing. This means that partnerships with the Writing Center might be useful. Either the time spent on citing sources was not effective (students’ annotated bibliographies suggest it was effective), or perhaps more likely students felt they didn’t need it.

Overall, being truly embedded into the class is a lot of work for the benefit of a relatively small number of students. Because of this commitment, there are always questions about how sustainable “embedded librarian” initiatives such as this one really are in the world of academic librarianship. Ethically, it is important to consider the extent to which devoting so much time and effort to the needs of a small number of students might impact the hundreds of other history and Spanish students who fall into my portfolio. Ultimately, I feel that in terms of student learning all the hard work was and will continue to be well worth the effort. I would not have committed to such an endeavor if I felt my other students were getting short shrift, and I now have three years of experience teaching this course and can say with some confidence that, at least for me, such an initiative can be sustained.

Librarians are concerned, rightly, about democratizing access to our services; we always want to make sure we’re reaching as many students as possible! It’s all about maintaining a balance, and yet we can probably do the most good by focusing our time and attention on those faculty and students who are most receptive to what we have to offer. One thing is for sure, the teaching role of the academic librarian has increased exponentially over the last 10-to-20 years, a trend that at this point is hard to ignore. TULibraries is recognized for its instruction efforts. While my “embedded librarian” course is only one small part of those efforts, I hope to continue refining and improving the embedded course.


For more information on David’s work, contact him at dcm@temple.edu or visit his guide for this class at: http://guides.temple.edu/las2098

Posted in instruction and student learning | Tagged , | Leave a comment

My Library Assessment Adventures

I have just returned from 5 days in Seattle, Washington to attend the 2014 Library Assessment Conference: Building Effective, Sustainable, Practical Assessment. This is a biennial gathering (now 600 attendees strong) and is sponsored by the Association of Research Libraries and the University of Washington.

The conference presents a fantastic opportunity to network with other professionals, learn about new tools, and keep up with trends in the library assessment and measurement community. It was especially fun for me to catch up with colleagues from past workplaces, including Syracuse, New Mexico State University and even the University of Louisville.

While I encourage you to explore the slides/presentations being posted at the conference site (http://libraryassessment.org/schedule/index~print.shtml), here are some of my personal highlights:

Using data analytics for prediction

Data is big. Several presenters encouraged librarians to pay attention to the higher education trend of using learning analytics to more proactively support student and faculty work and demonstrate value. Both Deb Gilchrist (Pierce College ) and Margie Jantti (University of Wollongong) spoke to the need for libraries to be more assertive in collecting data. Jantti’s research findings indicate, for instance, that students who do not use electronic resources will, on average, fail.

Gilchrist reminds us that we can get mired in descriptive analytics, and our time may better be spent thinking about predictive analytics. We need to think within the institutional context and proactively consider trends in higher education. She suggests that we might need to give up some of our principles for privacy – citing the example of Minnesota’s use of its Assignment Calculator (research paper analytics) to intervene at key points. She goes on to ask the question, “What would intrusive reference look like?”

Data Tools

Based on several powerful demonstrations of Tableau for presenting library data, I can’t wait to re-acquaint myself with this powerful tool for data visualization. Sarah Murphy was able to share some of her work on the public site at: https://carmenwiki.osu.edu/display/libraries/Dashboards. Rachel Lleweyan (UMass Amherst) and Jeremy Butler (University of British Columbia) also described best practices using Tableau dashboards to answer specific questions, provide multiple views of a single data set, and to generate new questions.

Space and Services

The University of Washington is a beautiful campus and this conference shows it off to advantage – both the physical spaces and the work of library staff. I particularly loved the newly renovated Odegaard Undergraduate Library with its open floor plan (that also accommodates quiet study), its active learning spaces with writable glass walls that can be adjusted for class use or open lab.

learning

This picture shows so much going on in one of the new spaces, both analog and digital technologies in use. And I was excited by Lauren Ray (University of Washington) and Katharine Macy (Tulane) account (Assessment of Space Designed for Experimentation) of the Research/Writing Center that is a partnership between the writing center and the reference services. Students can walk in or make appointments to consult with librarians and tutors to get support for writing and researching papers. There is natural linkage between these two services, and providing support to students in a shared space benefits everyone. The Scholar’s Studio is space that provides services for graduate students – they’ve experimented with lightening round research presentation events and a CoLab event designed to foster interdisciplinary collaboration.

Strategic Direction and How We Measure Our Progress

A key theme throughout the conference was demonstrating value and connecting library strategic direction with institutional goals. Roger Schonfeld (Ithaka S&R) addressed this in Vision, Alignment, Impediments, Assessment : The Views of Library with reactions from Anne Cooper Moore (Southern Illinois) and Scott Walter (DePaul).

Ithaka S&R conducts triennial surveys of faculty, their views on the library’s role in their work. They recently conducted a survey of academic library directors, and Schonfeld presented some results from this research, suggesting possible mis-alignment in how the role of the library is perceived by faculty and by library directors. While faculty value the library’s role as buyer, archive and as gateway to information, library directors see the support for research and teaching as of primary value,  as well as the increasing support for information literacy. Moore and Walter provided additional context from the library directors’ vantage point – that many schools are focusing on the needs of undergraduates, needs that may differ from faculty. These directors describe a library role that takes into account institutional missions as well as a role that serve the needs of faculty more directly.

By day 3, my head was exploding, but fortunately the slides are available for Steven Town‘s (University of York) provocative whirlwind presentation,  Making a Value Measurement a Reality: Implementing the Value Scorecard.

He extends the balanced scorecard approach further to explore the measurement of library values in the dimensions of relational capital, library capital, library virtue and library momentum. For example, the library provides the university with relational capital that can be measured by its competitive position (reputation beyond institutional boundaries). In the dimension of virtue, the library’s contribution to research, learning and employability of students might be measured. According to his paper (with Martha Kyrillidou, Developing a Values Scorecard), the value scorecard “provides a framework and categorization for the types of evidence required to prove the value and impact of libraries.”

Lastly – the coffee! There wasn’t lots of extra time, but I did my best to assess the options. My favorite – Cafe Solstice.

latte


Posted in conference reports | Tagged , | Leave a comment

Exploring Faculty Preferences for E or Print

Fred Rowland (librarian for Classics, Religion and Philosophy) in the RIS department conducted a survey recently on the format preferences for reading scholarly materials. Assessment Librarian Nancy Turner asks him about his project.

NT: What was your question?

FR: I was interested in how the faculty and graduate students in the departments of Classics, Religion and Philosophy were using e-books in their research work. I wanted to “take the temperature”. Did they have a preference for one format over the other and in what areas? Books? Journal Articles? Recreational reading?

I first considered conducting one-on-one interviews but decided to first conduct a survey to get “the lay of the land”. I have access to the email addresses, so I used that and sent a survey using Google Forms to 150 people. I felt I had a pretty good response rate, and got 49 replies right away. I never sent a reminder.

One of the hardest things was to write the questions. I’d never done a survey before. My interest was in reading habits for scholarly research material – so it was difficult for me to find a way to word this so that it was clear what I meant. So I asked how much time per week that was spent reading these formats might be interesting. I also asked if I could follow up with them in person. About 22 said yes.

I felt it was a pretty good “amateur” survey – I felt I got at what I wanted to know.

In addition to the preference question, I asked what department and status (graduate student or faculty) the responder was – I also separated out the journal article reading from the book reading.

NT: Tell us about your results

FR: I wasn’t too surprised by the results.

  • 85% expressed a preference for printed books over e-books.
  • A lesser percentage expressed a preference for print reading a journal article or recreational material.
  • There was no significant difference between the preferences of graduate students and faculty.

I’ve shared the results of the survey with Brian (Head of Acquisitions). I don’t think I’ll be making any changes in how we purchase materials in my subject areas, but I feel more comfortable with the decisions we’re making. I’ve also shared the survey results with the academic departments.

NT: Is there anything you’d do differently?

FR: As I said, writing the questions was hard and I’d try to better articulate what I want to know before writing the survey questions. But I was curious about how faculty and students were responding to our increasingly electronic collection of books and I wanted to gauge their reaction to this change, particularly as it relates to their research work. I think this kind of activity demonstrates our interest in what they think. It helps me keep a pulse on what’s going on in my departments, and keeps the communication going.

For more information on Fred’s work, contact him at frowland@temple.edu.

Posted in service assessment | Tagged , | 2 Comments

Assessing How We Process Special Collections

Katy Rawdon (Librarian and Coordinator of Technical Services) in the Special Collections Research Center initiated an assessment project in the technical services area of Special Collections. Assessment Librarian Nancy Turner asked her about this project.

NT: What were you trying to accomplish?

KR: I’ve been here at Temple University for 1 1⁄2 years and when I came there wasn’t a systematic method for tracking the work of processing and cataloging special collections materials . I wanted to make sure that we were capturing numerically all that we are doing. I felt it was important to define which pieces of our work we are measuring and then define how we are measuring it.

To address this, I created a spreadsheet with tabs for each staff member in the SCRC with responsibility for any technical services work. The spreadsheet has columns for the different activities we do: from accessioning new materials to archival processing and the creation of finding aids and bibliographic records, to book cataloging and clean-up of legacy data. We’re also now surveying all of the archival and rare book materials in our collection – sort of a retro-active accessioning, and we’re tracking that work, as well. Since this was a new tool for tracking work, I met with each staff member individually to review
the definitions, procedures and how they would contribute to the spreadsheet. Periodically, I remind staff to record their statistics but in general the system is working well.

NT: Tell us about your results

KR: It’s really fun to see the numbers and it is encouraging to staff members to see this impressive (and accurate) documentation of their work effort. It’s motivational. Having these numbers is great for planning and prioritizing our work.

NT: How are you using your results?

KR: We have the goal of completing the survey of our collections before we move any into the planned new library building. We need to know what we have, and we need to provide housing for some materials before we move them. Pretty soon I’ll be crunching numbers to learn whether or not we’ll need to step up our pace. In general, the spreadsheet helps us understand how our time is spent in different types of activities.

One question I have is whether at our current rate of processing and cataloging, we will be able to keep up with incoming new collections. What adjustments do we need to make to our staffing levels or the way we’re processing collections in order to keep up with our work? To avoid increasing our backlog? Should we process collections at a less detailed level, allowing us to make more collections available? And if we need more staff resources, this kind of data will help us to advocate for those.

NT: Is there anything you’d do differently?

KR: Overall, I’m pretty happy with how I set up the spreadsheet. And I’m really happy that we had the system in place as we started the survey project, so we could track it from the beginning. The spreadsheet is pretty flexible, so I can add or refine categories as needed. I only wish I started the project earlier!

For more information on Katy’s assessment of technical services work in the SCRC, contact her at krawdon@temple.edu.

Posted in process improvement | Tagged | Leave a comment

Welcome!

Welcome to the Temple University Libraries blog Assessment on the Ground!

The purpose of this blog is to share stories of assessment conducted by library staff here at Temple. We hope to model best practices and also demonstrate the many ways and forms that assessment can take place in the library setting. It may relate to technical services and creating efficiencies there, or assessing effectiveness  in the public services realm. We may look at the user experience of our virtual or physical library spaces.

This blog is meant also to serve as a forum for sharing news of assessment practices at other academic libraries. The posts are intended to spark dialog at Temple University (and beyond) about current trends and best practices in library assessment.

Thanks in advance for your participation. Comments are turned on!

Posted in organization culture and assessment | Leave a comment