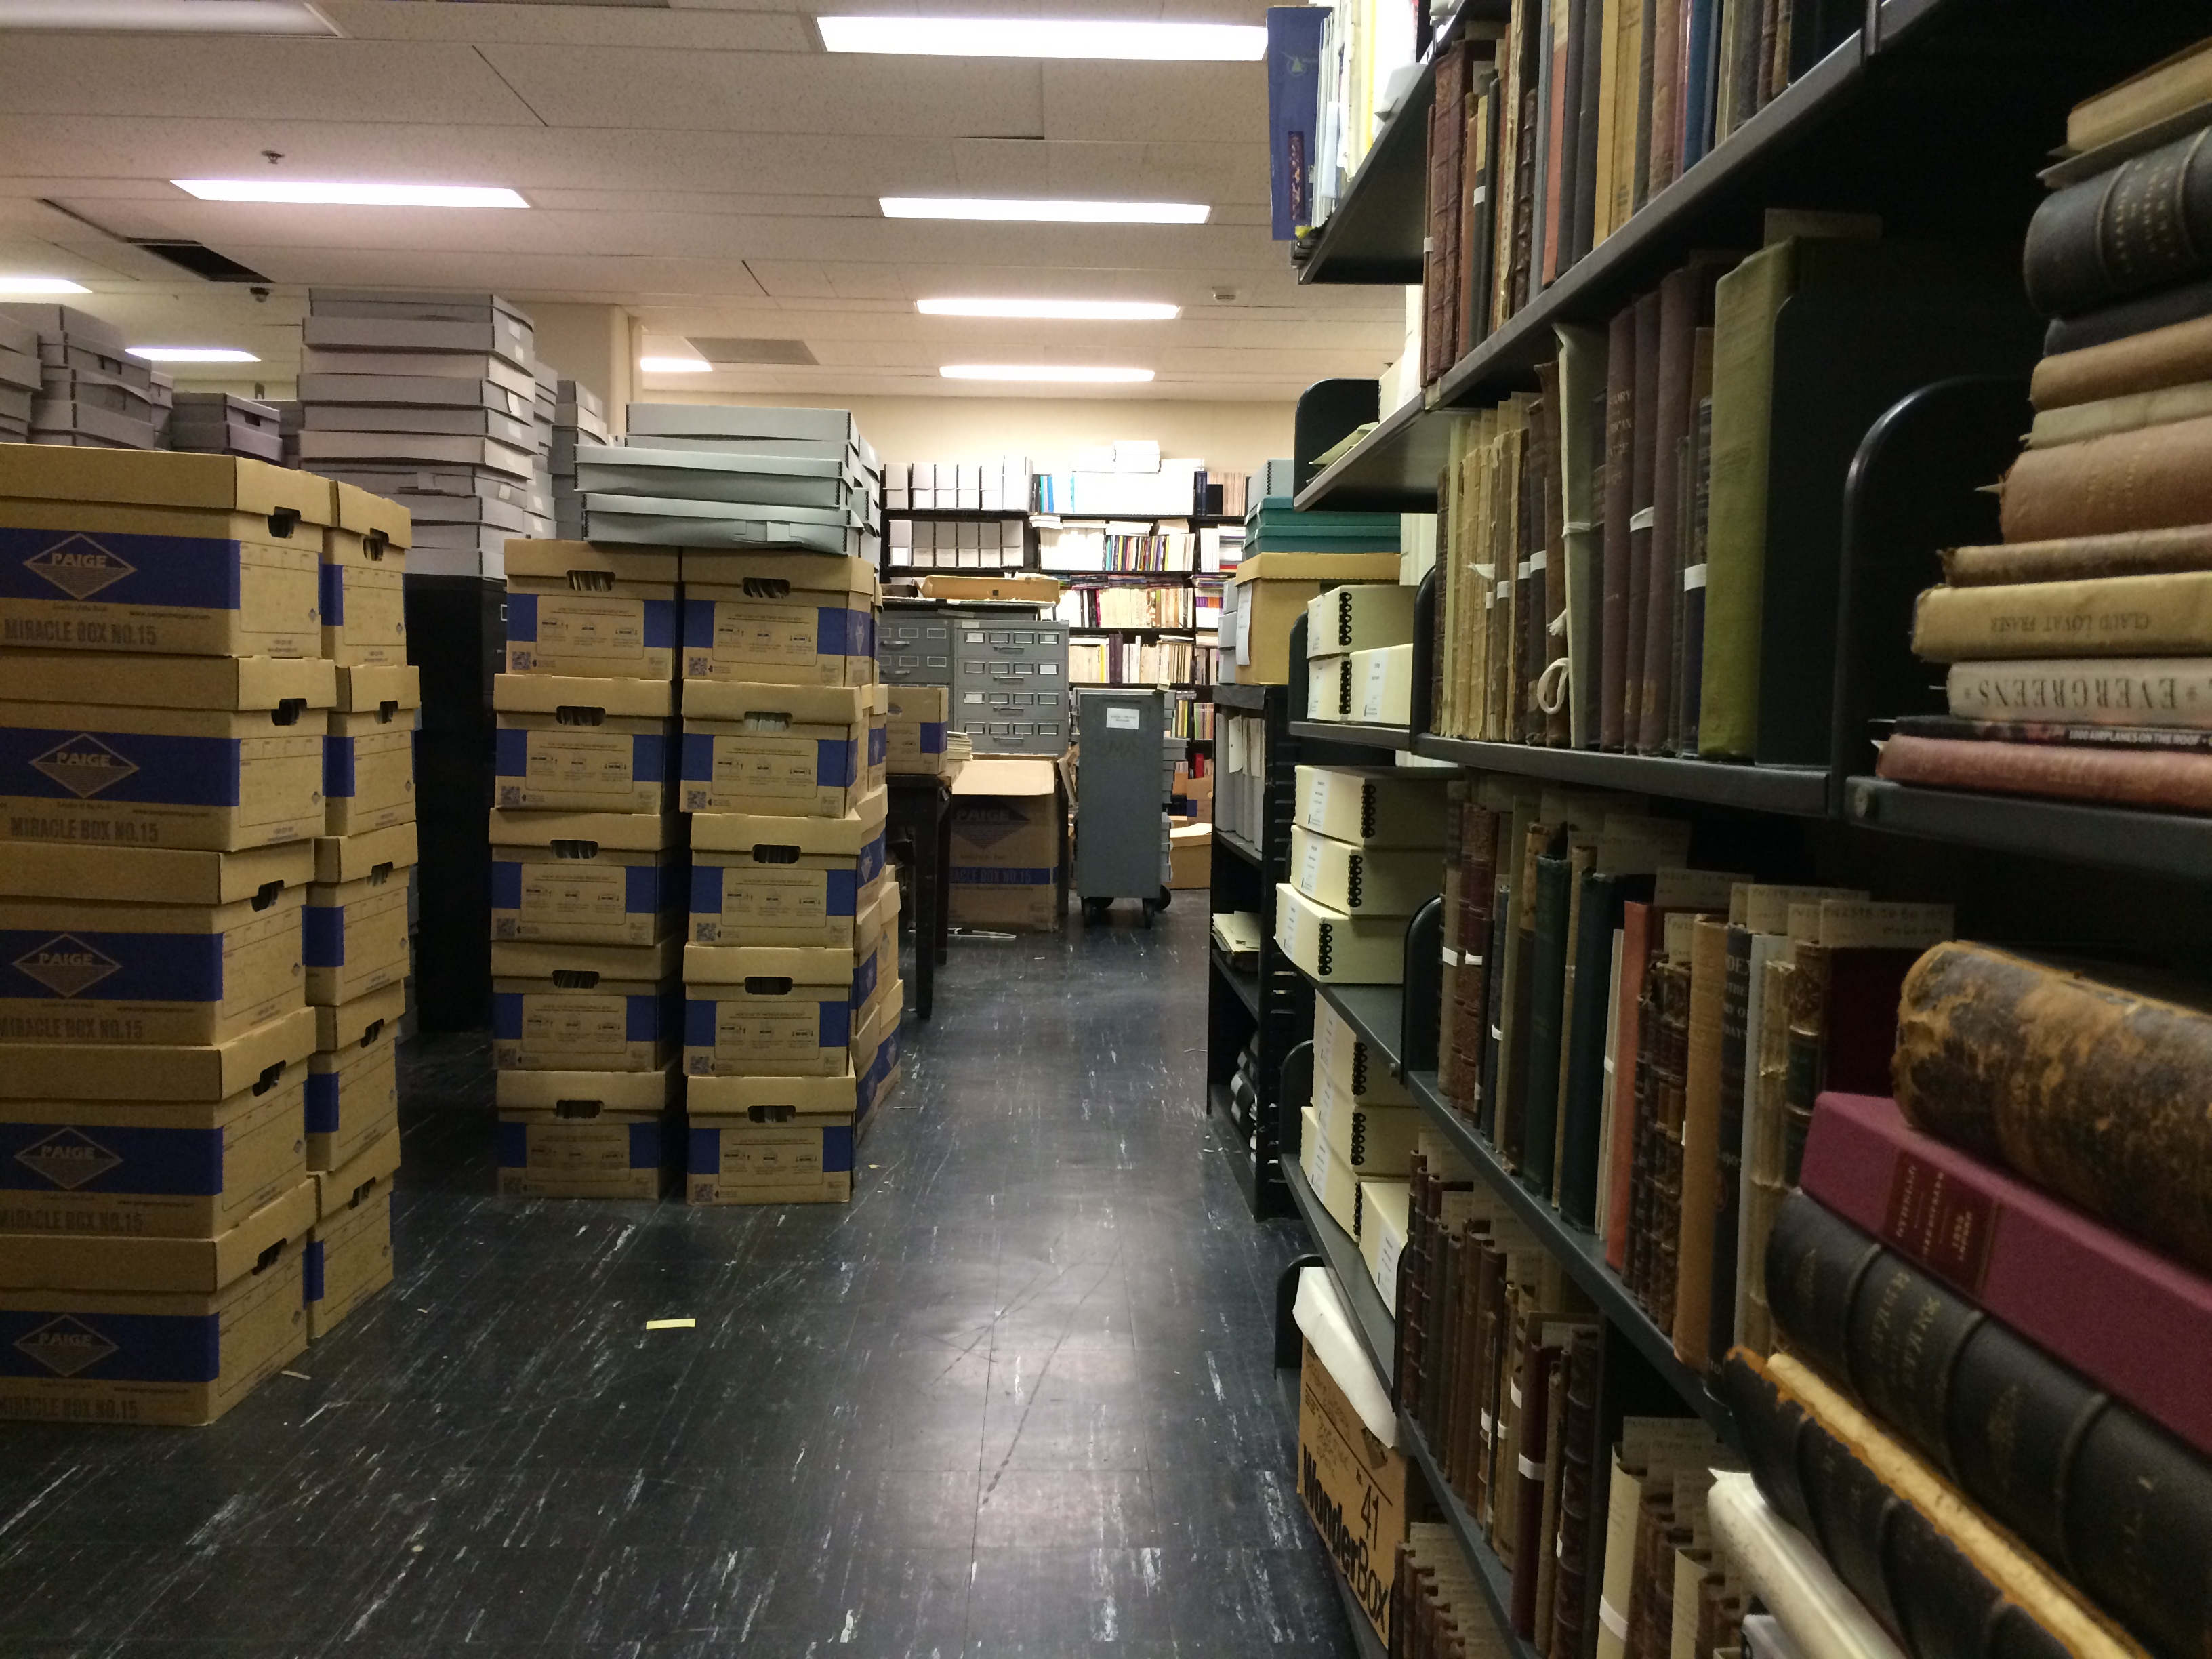
Assessment Reflections 2016

January is a time of reflection – this post is just that, some ideas that sparked my interest last year, with hopes of delving into them more deeply in 2017.

Sunday morning’s radio listening was doubly-rewarding, as I heard two of my favorite woman in media: Krista Tippett, host of On Being: The Big Questions of Meaning, interviewed Maria Popova, the creator of Brain Pickings, an amazing weekly compilation of her reflections on vast and deep reading in a range of literature, from science and philosophy to poetry and children’s books. Popova covers deep territory in the interview, from the perpetual process of identifying self, to the balance of acquiring new information (easy) to thinking and knowing (hard). She has real skepticism about our pursuit of productivity, or the illusion of busyness as real productivity. But back to assessment.

Are We Using the Right Data?

Towards the end of the conversation Tippett asks Popova how she measures success; what external success might look like. My ears perked up. This is a question I am continually asking of my colleagues, as a way of considering appropriate measures for assessment. Popova describes how she used to pay attention, and “hang her sanity” on metrics such as Facebook likes and retweets. They are “so tempting and so easy because they’re concrete. They’re concrete substitutes for things that are inherently nebulous.“

But she says now, the “one thing that I’ve done for myself, which is probably the most sanity-inducing thing that I’ve done in the last few years, is to never look at statistics and such sort of externalities. But I do read all of the emails and letters — I also get letters from readers. And to me, that really is the metric of what we mean to one another and how we connect and that aspect of communion.”

Popova’s words eloquently express thoughts I’ve had this year related to data and meaningful metrics. We talk of data-driven decision making, but is the data we are using the right data? Can numbers alone measure success?

If we are going to make changes based on evidence, whether qualitative or quantitative data, we need to agree on those measures of success. Decision making for organizational change comes about through a collaborative negotiation of shared program goals and agreement as to how success will be evaluated.

Assessment and Organizational Structures

I’ve also been thinking a good deal about how assessment and organizational structure are connected. This year I participated in many teams, (Single Service Desk Design, Physical Collections, the Ithaka Religious Studies Faculty project, the Data Dashboard group). It makes sense, as much of our work in assessment necessitates a team organization.

I think these projects work well, are exciting and promote mutual learning – because of some factors:

  • there is a common goal – sometimes there is a formal charge, but not always.
  • they bring together interested staff members who bring expertise, but also a motivation and belief in the project at hand
  • they also allow for a less departmentalized, “silo’ed”, work towards innovation and problem solving. Teams work best if there is partnership and collegiality rather than hierarchy.
  • and ideally, teams engaged with research and assessment use their findings to promote organizational change

But that organizational change only comes about with agreed upon evidence for those changes.

So in my own role as assessment librarian, I battle with these two, almost contradictory things, all the time. How do we balance our value for data-driven decision making, while recognizing that these measures are imperfect in describing the complexity of real life and what is truly meaningful? Your thoughts, welcome!

Posted in organization culture and assessment | Tagged , , | Leave a comment

When Numbers Fail Us

The recent election demonstrated in a powerful way the limits of data, in this case a multitude of polling numbers, towards understanding, or planning, for our  future.

hillary-wins

New York Times. http://www.nytimes.com/interactive/2016/upshot/presidential-polls-forecast.html

As an assessment librarian who counts on numbers to tell a story, I could not help but take this “failure” to heart. In our talk of data-driven decision making – what are we missing? Are we not asking the right questions? Or do our lenses (rose-colored glasses?) prevent us from seeing the whole picture?

I touched on this topic at the recent Charleston conference, where I participated in the panel Rolling the Dice and Playing with Numbers: Statistical Realities and Responses.

I discussed balancing the collection of standard library data elements over time, in order to discern trends, with the changing nature of metrics required to provide a meaningful reflection of the 21st century library’s activities and resources.

Last year, the Association of Research Libraries (ARL) and the Association of College & Research Libraries (ACRL, ALA) formed a joint advisory task force to suggest changes to the current definitions and instructions accompanying the Integrated Postsecondary Education Data System (IPEDS) Academic Libraries (AL) Component.

For example, the IPEDS instructions for counting e-books originally said to “Count e-books in terms of the number of simultaneous users” – a problem if we have a license with no access restrictions. Another example is IPEDS’ request that libraries NOT include open access resources, including those available  through the library’s discovery system. Not only can this be a difficult number to collect, but counting only the resources “we pay for” goes against the library’s value of making available quality, open access resources to its community.

A continuing discussion on library liservs is related to whether our traditional metrics were “meaningful”. The question was prompted by the publisher of Peterson’s College Guides requesting we report a count of a library’s microforms. We must ask ourselves, “What sort of high school student selects a school based on the library’s collection of microfiche?”

Increasingly, I am frustrated by the “thin-ness” of our metrics, the data that we use to measure ourselves and our success. Not just that it doesn’t tell a robust story. But it also seems to pigeon-hole us with an out-dated notion of what the library does and the service it provides.

Usage metrics are proxies, but are not measures of success. We need to dig deeper. Our instruction statistics demonstrate growth in sessions and students served. Yes, we reach out to faculty and we may be asked back into the classroom.  But are we able to demonstrate real learning? How are we demonstrating effectiveness? For instance, we might be more deliberate and systematic in collecting data related to our partnerships with teaching faculty –  developing better course assignments; end of year feedback loops on student learning.  These are harder, a little fuzzier, but arguably more important, measures of our library work.

Posted in conference reports, instruction and student learning | Tagged , , | 1 Comment

Lighting the Path with Assessment

path-of-light

Every two years librarians engaged with assessment gather together to share stories, methods, and research findings. We inspire one another as we work toward creating a culture of assessment at our institutions. This year 600+ of us met in Crystal City (between Arlington and Pentagon City) at the Library Assessment Conference sponsored by the University of Washington and the Association of Research Libraries. Conference organizers invited keynote speakers with the expectation of providing us with provocative food for thought —  these two did not disappoint.

Lisa Hinchliffe (University of Illinois at Urbana-Champaign) spoke of Sensemaking and Decision-Making.

Hinchliffe noted that higher education is experiencing increasing competition and financial pressures. This environment requires libraries to “pivot” – to re-consider what is central to our work and what we can leave behind.

  • What is the new work we can do?
  • Are we prepared to step up fast enough so that our funders can see our value fast enough?

The value the library creates is not just economic, although shared services and collections DO create economic value, as important are the values of equality-building (i.e.  inclusion, equity and social justice).

And assessment can serve as a map, or compass, towards the future – a kind of strategic guide. While an assessment program allows us to see different directions that are possible, it can not tell us which path to choose. The path must be selected based on how best we align our resources to our goals. How best to demonstrate, with evidence, our outcomes and value. Yes.

The next day we heard from Brian Nosek, University of Virginia, on Promoting an Open Research Culture. Nosek also directs the Center for Open Science (COS).

Through several participatory activities, Brian demonstrated that we can not help but experience the world through our own mind. Once we see a picture, it can be hard to see it another way. We all looked at the Horse and Frog Illusion, and while half the room saw a horse, others saw a frog. Try it out here.

In the research world, this idea relates to open access to data. Crowdsourcing the analysis of data makes for a more accurate and neutral picture of reality. Silberzahn and Uhlmann reported on an experiment with 29 teams of researchers, all answering the same research question with the same data set.

They found that the overall group consensus was “much more tentative than would be expected from a single-team analysis.” Crowdsourcing research, or bringing together many teams of researchers can “balance discussions, validate scientific findings and better inform policymakers.” (See the article in Nature)

Nosek went on to describe the Open Science Framework as an infrastructure for creating more open workflows that increase process transparency, accountability, reproducibility, collaboration, inclusivity and innovation. Exciting and important work.

So how does this apply to assessment? If nothing else, perhaps it will make us more humble as we talk about decision-making with data. We need to recognize that the data can tell many stories, and if we are to be honest and diligent in our work, we need to be open to the many ways in which those data can be interpreted and used.

Posted in conference reports | Tagged | Leave a comment

Finding the Sweet Spot for Library Instruction

This month’s issue of The Journal of Academic Librarianship features the research findings of Barbara Junisbai, M. Sara Lowe and our own Natalie Tagge, Education Services Librarian at the Ginsburg Health Sciences Library.  Natalie and I talked about her compelling assessment project and its implications for practicing a more strategic approach to library instruction.

Nancy: What was the research question that you had?

Natalie: Well, the abstract to the paper nicely sums it up. We were looking to assess the impact of programmatic changes and librarian course integration on students’ information literacy skills.

Nancy: Since the research was conducted at your former library, can you tell me a bit about the school and the context for the research?

Natalie: Sure. Our study was conducted at Pitzer College, one of five undergraduate colleges that make up The Claremont Colleges. The library serves as the academic core for all the colleges. Of course each of the colleges has a personality, Pitzer is informally known as the “hippy” school! It’s small (1000 students) and the focus is on liberal arts college with strengths in environmental and interdisciplinary studies.  All the students across Claremont are required to take a First Year Seminar and  the seminar includes broad learning goals that include information literacy.

Nancy: How did you decide on your methodology?

Natalie: We wanted to use a rubric for a couple of reasons. We knew we wanted to look at research papers, the final product of the First Year Seminar. Rubric assessment is a good way for multiple people to evaluation/score work. Papers were collected from three consecutive years of First Year Seminar classes, a total of 337 papers from 44 courses. The librarian component for these classes changed between 2011, 2012 and 2013, respectively, allowing us to gauge impact of the librarian engagement with the class on the quality of student work, as expressed in the final paper.

Nancy: How did you develop the rubric you used?

Natalie: We didn’t want to re-invent the wheel. Carleton College had already developed a rubric that was well aligned with the ACRL (Association of Research and College Libraries) standards for information literacy.  The rubric is designed to assess written work in three areas: attribution; evaluation of sources and communication of evidence (integration of sources into the paper). We asked for permission to edit and use Carleton’s tool,  and also had the opportunity to review it with Megan Oakleaf, who is an expert in rubrics and instruction assessment (Meganoakleaf.info/publications.html).

Natalie: In addition to applying a rubric to the papers, the final product of these classes, the degree of librarian involvement was scored on a scale of 1 to 4, with 1 being no involvement and 4 representing practically a co-teaching arrangement. This method was to determine the optimal mix of librarian involvement that would yield positive results on student papers.

Nancy: Will you tell me about your findings?

Natalie: Faculty collaboration with librarian had a demonstrated impact on student IL skills. But there is a faculty librarian collaboration “sweet spot” which is the “intermediate level” of collaboration.

This can include many things. For instance, the librarian is listed on the course syllabus as a trusted resource. There is often an online course guide. Ideally, the librarian visits the class twice – the first time to introduce the library and the second time to conduct an assignment-related session. Often there will be a course assignment that includes use of the library – like a bibliography attached to the paper. This proved to be was the optimal level of involvement, the most strategic.  Librarians self-reported this information, but we also used our instruction statistics.

Faculty also needed to hear this message – that assignment design, and a strategic instruction session, is the most impactful for improving students’ information literacy skills.

Nancy: How did you use the results of the research?

Natalie:  We presented to faculty the findings as a way of advocating for the benefits of library instruction. The research served as a basis for discussions with faculty. For instance, the one short session does not appear to be the best – a little bit more librarian involvement would lead to good gains in information literacy.

Nancy: Do you have thoughts on how this research would translate here at Temple?

Natalie: Temple has a very different population, and in particular, the students served by the health sciences library. So we need to look at the classes and the possibilities within the curriculum, being strategic and targeting the classes we spend time providing outreach to.

Nancy: Thanks, Natalie. Important research. I like especially that you used it to work with faculty to dialog about the different ways, and most strategic ways, librarians could work with their class and students. Thanks for sharing.

Posted in instruction and student learning | Tagged , | Leave a comment

Assessment Anytime, Anywhere

mm-machine

Yesterday’s staff carnival was a fun affair – lots of opportunity to meet new colleagues and learn about all the different areas of the libraries and press. Thank you Continuing Education Committee!

The Library’s Assessment Committee hosted a table, nicely appointed with displays of Association of Research Library reports ( to which we contribute), examples of data visualizations, and this blog site featured live on a laptop. We had the opportunity to introduce many staff members, and not just new ones, to the work we do.

We sponsored a numbers quiz as well. You can take in now (see below), but you won’t get a “prize” of peanut M&M cleverly dispensed from a gum ball “machine.” As typical of our collaborative efforts, the dispenser was on loan from Cynthia Schwarz and crafted by her grandfather! To tell the truth, it was the highlight of the table.

The quiz seemed like a fun way of challenging and impressing staff with the levels of activity here at the library, from the numbers of downloaded e-journal articles to the reach of our programs into the university and community.

After the event, I thought that I might have used this “assessment” in a different way. I might have tallied the results and presented them here. Just as a way of demonstrating a kind of assessment in a fun way.

So this time around we’ll do the quiz online and save the answers, conducting a brief assessment of how well staff have memorized these numbers. Just kidding, but do

numbers-quiz

Take the quiz

And let us know if these numbers surprise you.


Posted in organization culture and assessment, surveys | Tagged , , , | Leave a comment

Speaking of Scholarly Communication: Interviews with Faculty

Last week staff from Reference & Instruction, Access Services, the Press, Digital Scholarship Center, Special Collections,  Digital Library Initiatives, and Library Administration gathered for a conversation to share findings from a series of interviews we librarians had this past spring. Annie Johnson, with Greg McKinney, Rebecca Lloyd, Steven Bell and Kristina DeVoe talked with 7 faculty members in the humanities and social sciences about their use of social media, how they view open access and new trends in scholarly communication.

In a separate project, as part of the Ithaka S+R disciplinary research, Fred Rowland, Rebecca Lloyd, Justin Hill and I interviewed 12 faculty from Temple’s Religion Department. Our interests were similar: How do faculty choose where to publish their scholarship? How do they view new forms of scholarly communication? Are they using Twitter or other social media to share their research?

Here is some of what we learned:

Choosing a Publisher

Faculty continue to select publication venues based on the prestige of the publisher and journal. While there is no codified “list”, it is common knowledge in a discipline. The benefit of publishing with traditional publishers continues beyond tenure and throughout a scholar’s professional career – as merit points are assigned based on this prestige factor. When seeking an outlet, faculty “do not take chances” – typically, smaller, more focused journals are not ranked as highly.

Faculty seek a press who will actively market their book. They favor those publications with an efficient turnaround time, particularly when they are on the tenure “clock”. This urge for expedited publication  means they tend not to pay much attention to copyright and license agreements when signing off on the rights to their work. And the journal subscription cost is not a particular concern.

Open Access

Faculty we spoke with, all from the humanities and social sciences, do not consider that open access journals have the degree of prestige they seek. Many feel their tweeting and blogging, serves the purpose of making their research widely accessible. This very public activity makes it less incumbent on them to publish in formally open access journals.

That said, there was a wide range of attitudes about open access – from one scholar who is an advocate and very deliberate about his choice of open scholarship, to those who understand this to be the equivalent of posting one’s scholarship on a “random web site.” Graduate students are interested in new models for disseminated their research, but put off by the idea of an Article Processing Charge. Although this business model is not used in the humanities, the mis-information persists.

Discussing the various business models for journals let to a lively discussion about the library’s role in this kind of work. Many libraries, and ours as well, have a fund to support these APC’s associated with publishing in an open access journal. Our cost for a subscription has turned into a different type of cost. Annie, our Scholarly Communication specialist, attests, “Library supports dissemination of research to the world’ and this is how it fits within the Library’s mission. This is an expansion of the library’s role in supporting the scholarly apparatus.

New Modes of Scholarly Communication

For some, Twitter has replaced academic conferences for learning of trends in the field. A faculty member referred to it as the “new water cooler”. We spoke with a faculty member who archives his tweets to use as a journal for tracking his scholarly path. Other scholars were wary of social media – as scholars thinking about sensitive topics in religion, they may feel vulnerable about posting on potentially controversial topics. The disciplines certainly have different cultures of social media use.

Research into  Practice

Many Library/Press staff already follow Temple faculty and Temple authors on Twitter. It’s a way of providing support, of staying attuned to news and trends. We discussed tools like, “If This Then That” and Hootsuite for managing social media in a more efficient way.

To better support faculty and their questions about publishing issues and in  particular, license agreements, we discussed a kind of KnowledgeBase or closed archives online that would provide Temple scholars with suggestions for alternative license language, particularly for areas that are negotiable. The tool, useful for librarians and faculty, could provide definitions for better understanding of pre-prints and post prints. While faculty have awareness of “better and worse” agreements, they have little free time to think about it.

Thanks to all who participated in the conversation. It was great to share our findings with colleagues and to discuss practical implications  based on the research. For those interested in hearing more of the Ithaka interviews with religious studies faculty, please take a look at our Final Report.

Posted in qualitative research, research work practice | Tagged , , , , | Leave a comment

LibGuides Usability Testing

Temple Libraries has over 500 LibGuides, or Research Guides. The purpose of the guides is to help library users with some aspect of the research process. Most guides fall into one of three categories – those that offer links or helpful information related to specific disciplinary resources (subject guides), those with course-related information or resources (course guides), or those that provide general information about the library and its services (“How Do I” guides). A typical course guide, for instance, might include links to databases, books, websites, or instructional videos intended to help students complete research or other course assignments. The guides, authored by a variety of library staff, make up a large percentage of the library’s online content.

Last year, the Code Rascals group consisting of myself, Jenifer Baldwin, Brian Boling, John Pyle, and Caitlin Shanley, turned its attention to user experience, and LibGuides seemed like one online space ripe for analysis. We decided to conduct usability testing to learn how and if the guides are working for undergraduates, a primary audience for many of our guides. Our goal was to identify usability issues and to address those issues through guide and system-level design improvements, better content curation, and better web writing. With so many content creators, we knew we would likely need a set of guidelines to accompany our findings. Another goal of the usability testing was to establish ongoing best practices for guide authors.

Preparation & Methods

We recruited five participants, all first- or second-year undergraduates with a variety of majors. During the sessions we asked participants to perform research tasks and to “think aloud,” or talk us through what they were thinking as they performed the tasks. We designed each task to give us insight into how users fared with the system homepage, guide navigation, and finding resources, such as databases for research, within a guide. Participants engaged with all three types of guides: course, subject and “How Do I’s”. We also asked participants to freely explore the Research Guides for a few minutes and give us their overall impressions.

Analysis & Findings

We recorded a screen and audio capture of each session for more thorough analysis later. In our analysis we reviewed each recorded session as a group, noting usability problems and generating a list of potential solutions or best practices along the way. Our full report details observations and the full list of best practices. Below is a sampling of our observations.

Homepage & Guide Discoverability Issues

Users have trouble selecting a guide that can help them with a broad topic, and they may not realize they’re on a Research Guide once they arrive.

When asked to select a guide to research the topic “public art,” participants expressed uncertainty in the absence of a subject link or guide explicitly titled “public art.” This indicated to us a need to improve discoverability of guides through a more prominent site search on the homepage and better metadata at the guide level. Even after selecting a guide to research public art, participants remained uncertain that they had landed on a research guide. One commented that she was not sure she was on a guide, and another asked if the guide she had selected was in fact a guide. To us, this demonstrated a need to better brand the guides as a tool for research.

Guide-Level Issues

Users choose databases that are familiar or at the top of a list. Users also spend time reading database descriptions.

In tasks where participants had to find books and articles, we observed that participants did spend time reading database descriptions; however, they opted to search in databases listed toward the top of a guide page or the top of a list of databases. Some participants mentioned selecting a specific database, such as JSTOR, because they had encountered it before in high school or previous courses. Our recommended best practice is for guide authors to list no more than three databases and to place lesser known databases towards the top to help build familiarity with resources students may not have previously used.

Extraneous information distracts users from finding what they need.

One task asked participants to find information in guides on how to cite a book in APA style. Some participants read explanatory text boxes and watched video tutorials on the guide’s homepage before moving on to the APA tab of the guide. Significant time was spent viewing this explanatory content before deeming it unhelpful. This indicated to us a need for How Do I guides to be oriented in a way that helps users complete specific tasks quickly. Also, we need to review video content to make sure it is up to date, short and to the point, and relevant to users’ needs.

Large headings help users scan the page to identify content that is most useful.

Though participants were sometimes distracted by content not immediately relevant to the task, we observed that large headings helped users quickly scan through guide content to locate what they needed. On the Audre Lorde Seminar course guide, which included large section headings at the time of testing, participants quickly scrolled to the appropriate area of the guide when selecting a database for research. We plan to increase the font size of box headings at the system level to create a better hierarchy of text on all guides and make the contents of the page easier to scan.

Novice users have difficulty with guides.

We observed that participants who were novice researchers struggled to find the resources and information they needed in LibGuides. This highlighted the need to design guides that work for audiences with a wide range of research skill levels. Guide authors might consider using language or visuals that instruct users on how and/or why to use a resource.

Future Steps

We’ve shared the final report and best practices generated from the first round of usability testing. Our overall study consists of three parts, two rounds of “think aloud” usability testing and one round of card sorting to learn more about the language and structure of guides. Card sorting was completed in the Spring, and we are currently analyzing the results. For the next round of usability testing, we plan to create two or three model guides based on findings so far and test the usability of those guides. At the conclusion of the usability study, we plan to create guide templates that reflect our best practices.

Posted in usability | Leave a comment

Reports from the Field: Assessment Discussion Group at ALA

orlando clouds

The ACRL Assessment Discussion Group meeting is always a bright spot at the ALA conference.  The group, with a discussion list of over 400+,  suggests topics of interest: this year we talked about  assessment of space in libraries and how it relates to student learning. We shared thoughts and best practices for assessing student learning outcomes, and we talked of visualization and dashboards for presenting library data. Three topics, three table discussions: here are some highlights.

Space Use Assessment

Libraries are using a variety of tools to gather data on how students use space, from snapshots of head counts and high traffic areas to tracking of wifi connections. Librarians continue to explore the use of high tech tools (infrared, pinging analysis, and camera’s that can blank out faces) to understand space use. But they also noted that decisions about library consolidation and closing are more often due to politics than based on library-collected data.

University of Missouri–Kansas City (UMKC) used a “photo elicitation” technique (made popular by Nancy Foster’s ethnography work). As the article about the research makes clear,  surveys and observation studies, “by design, … usually stay within existing boxes, making them suboptimal for holistic examinations required to lead major innovation or uncover new and unfamiliar aspects of user needs.” That idea and the project in full are described in: Nara L. Newcomer, David Lindahl & Stephanie A. Harriman (2016) Picture the Music: Performing Arts Library Planning with Photo Elicitation, Music Reference Services Quarterly, 19:1, 18-62

How do libraries connect space use with student success? Surveys on use of collaborative space, interviews with students about their “favorite” places to work, and correlation between computer use and GPA’s are methods in use.  While these relationships may be tenuous, it’s clear that student success and retention can be correlated to student engagement – this “sense of belonging” may be enriched by soft seating, a coffee shop, or the availability of partner services at the library, like a writing or tutoring center.

Learning Outcomes Assessment

Coordinators of information literacy   programs must balance a standardized approach to assessment balanced with their colleagues’  desire and need to maintain autonomy as teachers.  End-of-session worksheets to be completed by students may “stifle” teaching styles and yet, without standard measures that can be used throughout the program, it is difficult to get meaningful data about best practice.

All agreed about the necessity learning outcomes shared by both academic instructor and the librarian. To ensure there is common understanding, the University of Alabama  requires a 30 minute meeting prior to an instruction session. But in classes where instructors turn over each year, and there are high % of adjuncts, this kind of extended collaboration is a challenge.

Finally, librarians engaged in assessment need resources for good questions. Blackboard and LibWizard can support quizzes, and the Information Literacy &* Assessment Project out of Canada provides a good question bank for assessment of student learning outcomes.

While most of the librarians are using rubrics and pre/post testing, some see more value in understanding student practice rather than use of a standardized test. Are there qualitative methods that might help us come to this understanding? And if so, how best to report the results of that assessment? Because telling the story of our impact with instruction is a critical piece of our demonstration of value to the institution.

Data Visualization and Dashboards

Discussion at the data visualization table revolved around the various tools that libraries now use for making library data more accessible through visualization: Oracle, Tableau, R, PowerBI and others were mentioned.  Whatever the tool, a challenge shared by all is finding ways of presenting that data in a clear, digestible and usable form. How do we best tell the library’s story to its multiple stakeholders? From fact sheets and infographics to interactive story boards, this growing area of assessment practice merits further discussion and will be the subject of a future post.

The discussion group was lively and useful. Thanks go to the many participants and especially the meeting recorders who helped to capture all that transpired. The full set of notes is available at: ACRL Discussion Group Minutes

Posted in conference reports | Tagged , , , , , , | Leave a comment

Assessment and Games Intersect with Diamond Eyes

This spring Temple University Libraries commissioned a special project as part of the programming year’s theme of Games and Gaming. Nicole Restaino, Manager of Communications and Public Programming, worked with Drexel’s Entrepreneurial Game Studio as they developed a hybrid work of theatre and games – “The Diamond Eye Conspiracy.” The interactive work was enacted a Paley library this April, to great success.

EGS integrates video game design, physical theatre and dance. As they were developing the game, collaborators Daniel Park, Arianna Gass, and Joseph Ahmed collected data about how students used and perceived of the library. They conducted brief in-person interviews and surveys with students, using traditional methods of assessment but applied in a different way. Intrigued by their process, I interviewed a member of the creative team, Daniel Park.

NBT: Tell us a bit about your project, what was your intent, or your charge?

DP: Our primary charge was to create something that would help reveal the library’s resources, and make it feel like a unique and special place. Within that we were interested in creating a community, shining a light on the individual lives of the people that frequent the library, and of course, making a fun experience.

NBT: What about the data gathering process? What did you collect and how?

DP: When we were gathering data, we wanted to focus on questions that would help inspire the content of the piece. This included basic information like who uses the library and why, but also less traditional questions. We created a list of actions that might happen inside the library ranging from checking out a book and studying, to checking out a person and sleeping, and asked the people we surveyed to check out which they have done inside of Paley. We also asked people to tell us something they would want to do inside of the library, but felt like they weren’t allowed to. We thought we could use the performance as an excuse to let people break the usual rules of the space. We also performed one on one recorded interviews, as a way of collecting more stories about the library itself. One story in particular, about a student who had to live inside of the library, became the basis for the conflict of The Diamond Eye Conspiracy.

NBT:  How did you use the data you collected in your production? How did it inform you work?

DP: The data became a major part of both the story of the piece, as well as informing a little bit of the content and aesthetic. Because we didn’t have a specific starting point for the piece, other than that it needed to happen inside of the library, pretty much all of our inspiration was garnered from the data we collected, and a small bit of research on the history of Temple and the library.

NBT: Did anything surprise you that you learned about students and how they viewed the library/what behaviors were expected and what wasn’t “allowed”?

DP: Sleeping in the library is really divisive. A lot of students have done it, and a lot of them want to, but about half of the group we surveyed felt that it was, “Against the rules.”

NBT: Are there differences in how you’d use what you learned as artists than if, say, you were library staff making decisions about library design or service?

DP: Yes and no. I’d striving towards the outcome of making the library a communal space, arranging it towards how people actually use it, and how people want to use it, would be a goal in common. But we had more flexibility to do something impermanent that could be a little bit more interrupting. I think more questions of sustainability and practical usage would need to come into play. But, I think keeping a value of playfulness and activating the space in unexpected ways, could result in some cool design and service projects.

Overall, a great example of how creativity and assessment work together in providing for a more  user-friendly, user-aware library environment. Thanks to Nicole for getting behind this edgy, playful and ultimately very successful public program.


Posted in library spaces | Tagged , , | Leave a comment

Supporting the Needs of Faculty – The Research Services Forum

The Research Services Forum met last week to discuss the recent Ithaka Faculty Survey.  Ithaka S+R has conducted a survey of faculty every three years since 2000, providing libraries with a “snapshot of practices and perceptions related to scholarly communications and information usage.” This year, the survey population consisted of faculty members from all disciplines in the arts, sciences and most professions at U.S. colleges and universities (offering bachelor’s degree or higher). This translates to a  survey distribution of  145,500 faculty members yielding a response of 9,203 (6.3%). The Ithaka surveys rightfully receive a good deal of attention in the higher education and library press, as providing  useful data on trends in faculty perceptions and needs – essential for librarians to know about and consider for their own work.

Ithaka Faculty Survey: A Key Finding

Discovery starting points remain in flux. After faculty members expressed strongly preferring starting their research with a specific electronic research resource/database as compared to other starting points in previous cycles of this survey, they are now reporting being equally as likely to begin with a general purpose search engine as they are with a specific electronic research resource/database. Furthermore, the online library website/catalog has become increasingly important for conducting research since the previous cycle of the survey.

This finding was based on the following question and response, “Below are four position starting points for research in academic literature. Typically, when you are conducting academic research, which of these four starting points do you use to begin locating information for your research?”

ithaka survey questionThis finding is notable as an indicator of changing  research behaviors, as well as for its potential implications for library work. But it’s a bit more complicated.

Local Research with Religious Studies Faculty

The timing of Ithaka’s publication was fortuitous, as here at Temple Libraries we are also talking with faculty about research practice and beginning to synthesize our local findings. Ours is also an Ithaka-sponsored project with a different methodology – a series of structured open-ended interviews with 12 faculty in the Religious Studies department. The local research team is made up of Fred Rowland, Rebecca Lloyd, Justin Hill and myself. Fred did a great job of contacting faculty and helping to arrange the interviews – the research team shared conducting interviews and reviewing the transcribed recordings. Update: Final Report is now posted here:  templeuniversity_religiousstudies_finalreport.


The project is part of a broader investigation into discipline-specific practice (the final report will include 40 libraries), but covers similar ground to understand how faculty:

  • Position their work in the academy
  • Locate their sources
  • Select where to publish, including use of open access
  • Manage and store data
  • Use social media
  • Keep up with trends in the field

A question posed to Temple faculty was related to the survey’s “starting point” question but worded somewhat differently. We asked,  “How do you locate the primary and/or secondary source materials you use in your research?”  There was tremendous variation in how this question was answered, and how it was understood. For instance, faculty members do not have a fixed, single “starting” point. This depends on many factors: the specific project, the seniority of the researcher, and the scholar’s relationship to the librarian.  Faculty members are often unclear as to where they are, and what tools they are using,  when looking for information. They describe “The portal” 0r the “humanities search engine”. Is this Summon? JSTOR, The library’s website?

But the greatest challenge, for our religious studies scholars, is tracking down archival and primary source material that may reside in schools, theological libraries and historical societies. Senior scholars tend to use their own social/professional networks when exploring a new topic. Others may reach out to their liaison librarian for guidance in the specific databases and search strategies appropriate to their topic.

Methods

The value of a qualitative interview for these kinds of questions is the possibility of probing deeper with the participant. What seems like a simple question, “How do you begin your research?”, yielded complex and at times, confounding responses. Can a survey adequately get at this? Are there ways in which the library should be acting upon these findings? Fortunately, the Research Forum provides an opportunity to share and discuss this kind of research and its implications for library services and practice.

Thanks to the organizing group (Brian Boling, Kristina DeVoe, Andrea Goldstein, Josue Hurtado and Margaret Janz) for inviting us to talk about the Ithaka research projects. More to come.

Posted in research work practice | Tagged , , | Leave a comment