In some ways, the virtual conferences that arose from necessity out of the pandemic are a boon for science. No travel increases foreign participation and, arguably, student participation as well. A case in point is the upcoming symposium Application of Proximal and Remote Sensing Technologies for Soil Investigations, 17-19 August 2021.
Ordinary, I would skip this event as it occurs too close to the start of the fall semester, but as a virtual event, this poses less of a problem. Below is the abstract my student, Gina Pope submitted.
ABSTRACT
Hysteresis: Implications for Soil Moisture Estimates Based on Electrical Conductivity
Gina Pope, Laura Toran, and Jonathan Nyquist
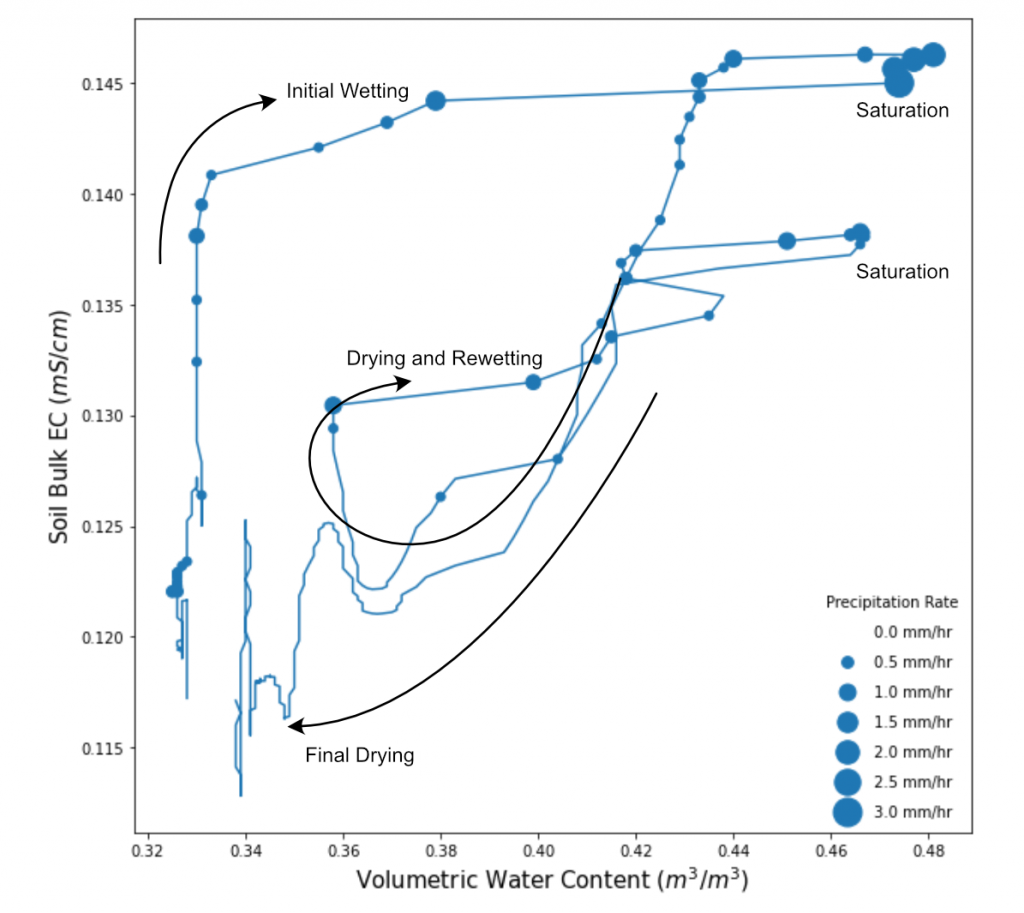
Hysteresis: Implications for Soil Moisture Estimates Based on Electrical Conductivity Gina Pope, Laura Toran, and Jonathan Nyquist It is well known that soil water retention curves exhibit hysteresis: the water potential as a function of moisture content during drainage is different from imbibition. Less well known is that the electrical conductivity of the soil as a function of volumetric water content (VWC) can also exhibit hysteresis. Archie’s Law, and other constitutive relationships, commonly used to calculate soil moisture from electrical conductivity/resistivity data ignore hysteresis. Although they have parameters that depend on soil composition and structure, all associate a single moisture value with each conductivity value for a given soil, leading to possibly incorrect soil moisture predictions. To illustrate the problem, we have plotted VWC versus EC for data collected with a Terros 12 sensor installed at a depth of 38 cm at an abandoned lot in suburban Philadelphia. Two rain events occurred during this period, leading to an initial saturation of the soil, a partial drying, then a second period of saturation followed by a gradual return to roughly the antecedent condition. The relationship between VWC and EC is clearly not monotonic. For example, a bulk EC reading of 0.13 mS/cm corresponds to three different soil moisture values ranging from 0.33 to 0.40 m3 /m3 . To choose the correct VWC value one would have to know where within the imbibition and drainage cycle the measurement occurred. The standard practice when using time-lapse electrical resistivity tomography to monitor infiltration, for example, is to collect a background resistivity survey to serve as a reference when inverting the monitoring data for percent change, and measuring a few additional times along a wetting cycle. Picking a relationship between soil moisture and conductivity based on a few points to describe rain events could lead to misinterpreted results when there is hysteresis. We have observed varying degrees of hysteresis at different field sites spanning a variety of soil types. We do not know if the hysteresis is caused by differences in pore fluid geometry during wetting and drying (the ink-bottle effect), as suggested by Knight (1991), or changes in pore water ionic strength as dilute rain water enters the soil and then equilibrates. Quite possibly both are important. The salient point is that hysteresis should be considered whenever soil resistivity/conductivity data is being used to estimate soil moisture content. The continuation of this research will involve analyses of other sensors at different sites across multiple storm events and the simultaneous collection of pore water samples. Laboratory soil column studies might also provide a resourceful avenue for further investigation.
Figure Caption
Data from a buried soil sensor buried at a depth of 38 cm shows changes in bulk conductivity and soil moisture collected on a 15-minute interval over eight days. Point size indicates the precipitation rate. Two rainfall events are shown, twice saturating the soil. The plot shows hysteresis during the wetting and drying cycles. Consequently, the soil true soil moisture value is not uniquely determined by the soil conductivity.

