This post re-visits a project I blogged about several months ago. I interviewed Jenifer Baldwin (Head of Reference and Instruction Services) Anne Harlow (Librarian for Music, Dance, and Theatre) and Rick Lezenby (Librarian for Psychology and Political Sciences). They were in the preliminary analysis stage of qualitative research for which they conducted 10 structured interviews with faculty members from as many disciplines. Their goal: to learn more about how and why instructors choose and share content with their students.
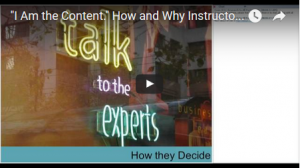
They had the opportunity to present their work to a national audience January 12 of this year as part of an OCLC webinar series. A recording of that session and the slides are now available.
The interviews revealed how the faculty experience of discovery is rooted in their self-identity as readers and experts, and is something they aim to model for their students. The results from these interviews may suggest ways for libraries and publishers to influence what content faculty select and integrate into their teaching.
Scholars look at the world with a lens through which they are always on the look out for source material. A New Yorker cartoon, a graph, poetry – much of the content they incorporate into their assignments is not necessarily library material. A researcher needs a good deal of content knowledge for this serendipitous type of discovery to make sense, whether it is browsing the vast stacks at the library or perusing a bookstore. Faculty may also utilize personal networks of fellow experts, the “invisible college”, to pull together course material.
One of the surprising findings to the research team was that undergraduates are expected to read very broadly, where as graduate students focus their research and reading in a different way. It’s assumed, perhaps, that advanced students have done the contextual reading and their task is narrow their research. For undergraduates, print handouts distributed in class are privileged over resources posted to online course management tools like Blackboard. This ensures that students will really pay attention to what the instructor wants them to learn.
One of the most exciting aspects of this research is its potential for informing librarian practice. Rick says, “I listen more closely to the student”.
Jenifer’s practice is also changing. She says, “I am thinking about different ways in which we can support the work of students in their classes. For instance, rather than spend instruction time demonstrating how to search a database, I provide students with a screenshot of search results; we look at those and discern together how to evaluate those results. What are the clues? Then we look at the abstract to dig deeper into understanding. Finally, I ask students to underline critical clues in the first page of the article, to see what more is there.”
A practical implication for libraries: Liaison librarians are well-positioned to provide much needed support for teaching faculty, providing timely, highly-relevant content in digestible, mashable components that teachers can easily incorporate into their instruction content. A kind of “buzzfeed for teaching”.