Last year I profiled Cynthia Schwarz, Senior Systems & Technology Librarian on her assessment of computer use at the Ginsberg Health Services Library. She was using the software LabStats to analyze the use of computers at the library – the software allows us to understand not only the frequency of computer use and where those highly used computers are located, but the school and status of our computer users.
This year she’s taking her efforts further, using this data to improve technology offerings and saving student money along the way.
NT: What was your question? What are you trying to understand?
CS: We know that technology needs are constantly changing. The Library currently provides over 150 fixed computer workstations, 65 circulating laptops and 32 study rooms equipped with varying levels of technology.
We had anecdotal evidence, based on observation, that not all our computers in the Library were being used. I wanted to understand more about what technology is used and how heavily – so we don’t replace less used equipment unnecessarily. That’s expensive and we could deploy those funds elsewhere, serving students better.
NT: What kind of data are you collecting?
CS: The Library has been collecting statistics on the use of library-provided technology since 2014. These data include the number of logins to fixed workstations, the number of loans for each piece of equipment, including laptops and iPads, and the number of print jobs sent to the student printers from fixed workstations and from the wireless printing service. As the hardware comes up for replacement, this collected data serves as an important road map in making decisions about what to replace.
I wanted to use statistics to assess the need for replacements of all this equipment. For instance, in the current fiscal year, 44 public iMac computers were up for replacement. Based on the data collected, no more than 21 of the 44 computers were ever in use at the same time. I determined that some of the iMacs could be eliminated without a felt impact to students.
But, we couldn’t simply remove computers at random. We looked at the specific machines that were used and where they were located.
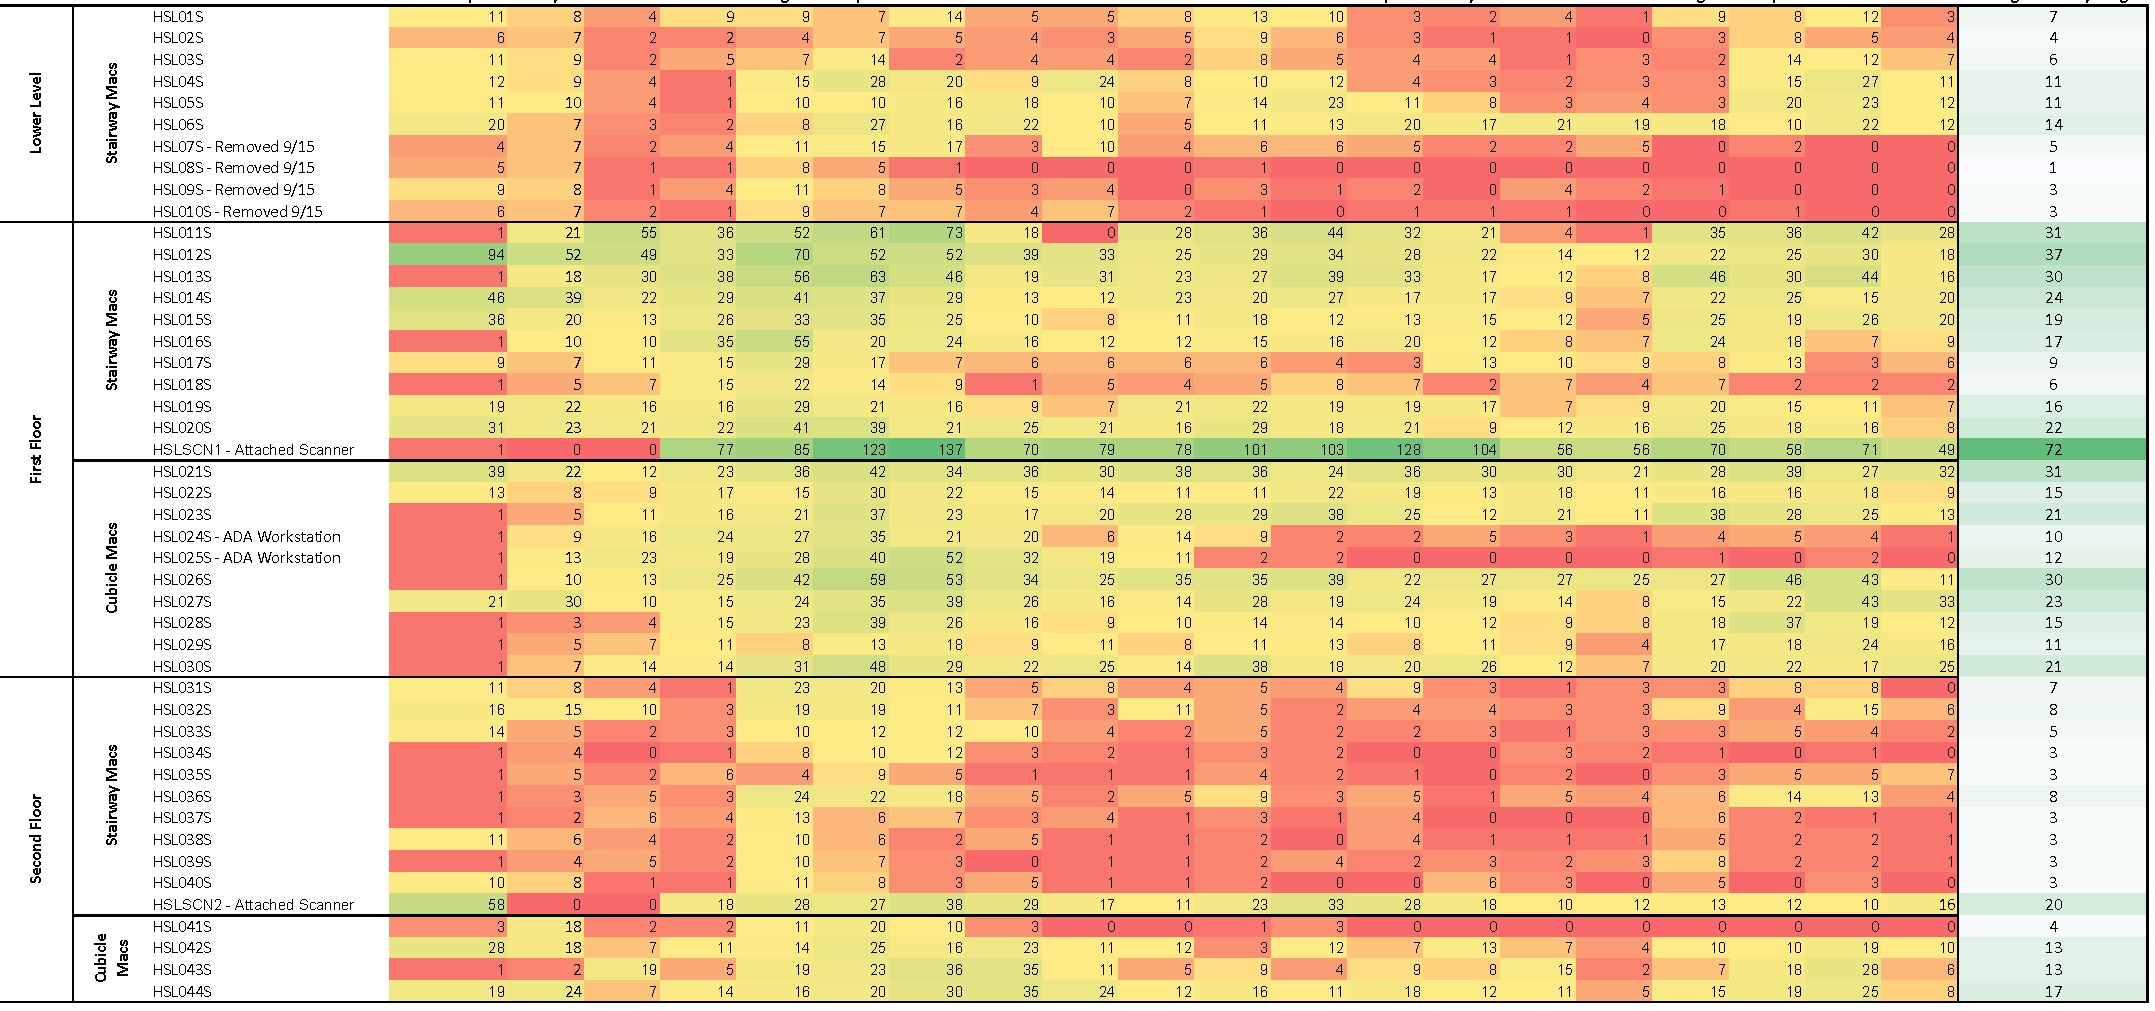
The heatmap shows pretty clearly that there are “zones” in the library, the 2nd floor, for example, where the computers were less used. These were the computers by the stairway, as well as computers inside of cubicles. In this area, students were more likely to use their laptops at bigger tables.
In the end, we reduced number of iMac workstations from 44 to 27, saving the library $32,900 in the first year and $2,700 each year after.
NT: Do you have any other assessment plans related to technology use?
This example is just the first piece of a much larger puzzle of making decisions based on data to determine how resources should be allocated to best support students moving forward. Throughout the spring 2016 semester, the library plans to review the fixed PC workstations, the study room technology and the laptop and iPad loaners.
The second step is to consider how to re-deploy those resources, i.e. money saved from hardware replacements. The Library is now able to invest in different technologies such as Chromebooks, 3D printing and scanning and specialized computers with high-end software.
NT: How do you learn about what those new technologies should be?
Because of its size, the health sciences library is a perfect testing ground for new technology offerings. We stay current with what other health sciences libraries are doing, we carefully analyze our usage data, and we talk to students.
NT: Thanks, Cynthia. Your work is a great example of using data to inform decision-making. This kind of analysis could be applied at the other library locations too – I imagine the technology use profiles at Paley, Ambler or SEL would look quite different — that would generate some interesting questions too.