Assessment and Games Intersect with Diamond Eyes

This spring Temple University Libraries commissioned a special project as part of the programming year’s theme of Games and Gaming. Nicole Restaino, Manager of Communications and Public Programming, worked with Drexel’s Entrepreneurial Game Studio as they developed a hybrid work of theatre and games – “The Diamond Eye Conspiracy.” The interactive work was enacted a Paley library this April, to great success.

EGS integrates video game design, physical theatre and dance. As they were developing the game, collaborators Daniel Park, Arianna Gass, and Joseph Ahmed collected data about how students used and perceived of the library. They conducted brief in-person interviews and surveys with students, using traditional methods of assessment but applied in a different way. Intrigued by their process, I interviewed a member of the creative team, Daniel Park.

NBT: Tell us a bit about your project, what was your intent, or your charge?

DP: Our primary charge was to create something that would help reveal the library’s resources, and make it feel like a unique and special place. Within that we were interested in creating a community, shining a light on the individual lives of the people that frequent the library, and of course, making a fun experience.

NBT: What about the data gathering process? What did you collect and how?

DP: When we were gathering data, we wanted to focus on questions that would help inspire the content of the piece. This included basic information like who uses the library and why, but also less traditional questions. We created a list of actions that might happen inside the library ranging from checking out a book and studying, to checking out a person and sleeping, and asked the people we surveyed to check out which they have done inside of Paley. We also asked people to tell us something they would want to do inside of the library, but felt like they weren’t allowed to. We thought we could use the performance as an excuse to let people break the usual rules of the space. We also performed one on one recorded interviews, as a way of collecting more stories about the library itself. One story in particular, about a student who had to live inside of the library, became the basis for the conflict of The Diamond Eye Conspiracy.

NBT:  How did you use the data you collected in your production? How did it inform you work?

DP: The data became a major part of both the story of the piece, as well as informing a little bit of the content and aesthetic. Because we didn’t have a specific starting point for the piece, other than that it needed to happen inside of the library, pretty much all of our inspiration was garnered from the data we collected, and a small bit of research on the history of Temple and the library.

NBT: Did anything surprise you that you learned about students and how they viewed the library/what behaviors were expected and what wasn’t “allowed”?

DP: Sleeping in the library is really divisive. A lot of students have done it, and a lot of them want to, but about half of the group we surveyed felt that it was, “Against the rules.”

NBT: Are there differences in how you’d use what you learned as artists than if, say, you were library staff making decisions about library design or service?

DP: Yes and no. I’d striving towards the outcome of making the library a communal space, arranging it towards how people actually use it, and how people want to use it, would be a goal in common. But we had more flexibility to do something impermanent that could be a little bit more interrupting. I think more questions of sustainability and practical usage would need to come into play. But, I think keeping a value of playfulness and activating the space in unexpected ways, could result in some cool design and service projects.

Overall, a great example of how creativity and assessment work together in providing for a more  user-friendly, user-aware library environment. Thanks to Nicole for getting behind this edgy, playful and ultimately very successful public program.


Posted in library spaces | Tagged , , | Leave a comment

Supporting the Needs of Faculty – The Research Services Forum

The Research Services Forum met last week to discuss the recent Ithaka Faculty Survey.  Ithaka S+R has conducted a survey of faculty every three years since 2000, providing libraries with a “snapshot of practices and perceptions related to scholarly communications and information usage.” This year, the survey population consisted of faculty members from all disciplines in the arts, sciences and most professions at U.S. colleges and universities (offering bachelor’s degree or higher). This translates to a  survey distribution of  145,500 faculty members yielding a response of 9,203 (6.3%). The Ithaka surveys rightfully receive a good deal of attention in the higher education and library press, as providing  useful data on trends in faculty perceptions and needs – essential for librarians to know about and consider for their own work.

Ithaka Faculty Survey: A Key Finding

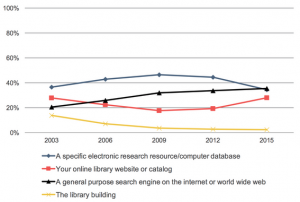
Discovery starting points remain in flux. After faculty members expressed strongly preferring starting their research with a specific electronic research resource/database as compared to other starting points in previous cycles of this survey, they are now reporting being equally as likely to begin with a general purpose search engine as they are with a specific electronic research resource/database. Furthermore, the online library website/catalog has become increasingly important for conducting research since the previous cycle of the survey.

This finding was based on the following question and response, “Below are four position starting points for research in academic literature. Typically, when you are conducting academic research, which of these four starting points do you use to begin locating information for your research?”

ithaka survey questionThis finding is notable as an indicator of changing  research behaviors, as well as for its potential implications for library work. But it’s a bit more complicated.

Local Research with Religious Studies Faculty

The timing of Ithaka’s publication was fortuitous, as here at Temple Libraries we are also talking with faculty about research practice and beginning to synthesize our local findings. Ours is also an Ithaka-sponsored project with a different methodology – a series of structured open-ended interviews with 12 faculty in the Religious Studies department. The local research team is made up of Fred Rowland, Rebecca Lloyd, Justin Hill and myself. Fred did a great job of contacting faculty and helping to arrange the interviews – the research team shared conducting interviews and reviewing the transcribed recordings. Update: Final Report is now posted here:  templeuniversity_religiousstudies_finalreport.


The project is part of a broader investigation into discipline-specific practice (the final report will include 40 libraries), but covers similar ground to understand how faculty:

  • Position their work in the academy
  • Locate their sources
  • Select where to publish, including use of open access
  • Manage and store data
  • Use social media
  • Keep up with trends in the field

A question posed to Temple faculty was related to the survey’s “starting point” question but worded somewhat differently. We asked,  “How do you locate the primary and/or secondary source materials you use in your research?”  There was tremendous variation in how this question was answered, and how it was understood. For instance, faculty members do not have a fixed, single “starting” point. This depends on many factors: the specific project, the seniority of the researcher, and the scholar’s relationship to the librarian.  Faculty members are often unclear as to where they are, and what tools they are using,  when looking for information. They describe “The portal” 0r the “humanities search engine”. Is this Summon? JSTOR, The library’s website?

But the greatest challenge, for our religious studies scholars, is tracking down archival and primary source material that may reside in schools, theological libraries and historical societies. Senior scholars tend to use their own social/professional networks when exploring a new topic. Others may reach out to their liaison librarian for guidance in the specific databases and search strategies appropriate to their topic.

Methods

The value of a qualitative interview for these kinds of questions is the possibility of probing deeper with the participant. What seems like a simple question, “How do you begin your research?”, yielded complex and at times, confounding responses. Can a survey adequately get at this? Are there ways in which the library should be acting upon these findings? Fortunately, the Research Forum provides an opportunity to share and discuss this kind of research and its implications for library services and practice.

Thanks to the organizing group (Brian Boling, Kristina DeVoe, Andrea Goldstein, Josue Hurtado and Margaret Janz) for inviting us to talk about the Ithaka research projects. More to come.

Posted in research work practice | Tagged , , | Leave a comment

Report from the Field: NISO Conference on Library Value and Assessment

Steven Bell and I were privileged to participate this week in the NISO virtual conference on Library Value & Assessment. The conference slides are available at: http://www.niso.org/news/events/2016/virtual_conference/apr20_virtualconf/

Presenting virtually, for me at least, was a bit nervous-making. Although we presented slides with audio, and I didn’t have to worry about my hair, it’s disconcerting to “present” to an invisible audience. Are they sitting with rapt attention or yawning? Fortunately our presentation, Why Library Assessment? A Look at Current Practice, went smoothly and then we could relax and enjoy hearing of great work from our assessment colleagues. Here is a brief re-cap:

Jocylyn Wilk, University Archivist at Columbia University, discussed the assessment tools in use at Columbia’s Rare Book and Manuscript Library in her talk, Why Is This Assessment Different from all the Others?  The Archival Metrics Toolkits provide a rich set of survey and focus group instruments for use in assessing the user research experience, special collections websites and online finding aids, and instruction with special collections. Advantages for using these tools are: they are pre-validated and findings can more easily be shared with other institutions.

Elizabeth Brown (Director of Assessment and Scholarly Communications, Binghamton University) spoke about: Leveraging and Interpreting Library Assessment: Pulling the Wheat from the Chaff. Brown provided us with some good rules for telling a story with data:

  • Remember your audience
  • Match content to knowledge level
  • Make message succinct
  • Link analysis to existing data
  • Show trends clearly – use simple graphs and charts
  • Make quotes for qualitative data –

Ken Varnum (University of Michigan Library) spoke about Information Resources: Justifying the Expense; the kinds of data that libraries can use to demonstrate value. He raised some provocative questions related to our understanding of use data. For instance, does access (i.e. the download of an article as reflected in a COUNTER report) equal use? Is some use more valuable than other use, i.e. the use of collections by faculty rather than adjuncts? What about the kind of collection use that leads to new research? Or helps the faculty member get a grant?

Varnum noted that there is a big black hole, from the analytics perspective, in the use of the free web. Not only are we unable to track this usage, but we don’t know the scope of usage relative to what we license and pay for. To what extent do proxy users represent all users? While these are difficult, at times uncomfortable questions, they may be important ones to address as collection funds become limited.

In We’re Not Alone,  Jan Fransen at the University of Minnesota reported on that institution’s exciting work to understand the relationships between use of the library and student success. Their research reflects years of relationship building and data collection with libraries data, the Office of Institutional Research and Academic Advising for  student demographics as well as data related to student success.  The library can confidently demonstrate, for instance, that use of the library at least one time increases the odds of a student staying in school. More on their research is located at:  z.umn.edu/LDSS

Kristi Holmes (Northwestern Medicine) updated us on the Library-based Metrics & Impact Core. Northwestern’s Impact Core is a new kind of service that is a perfect fit for the library, and also supports the university’s reputation building capacity. With expertise in bibliometrics, data visualization, continuous improvement, information systems and alternative metrics, staff in the Impact Core provide extensive advisory services for researchers, as well as departments and university administration.  With classes on bibliometrics for researchers and increasing impact of research, the library has also become the “go to” place for publication data used not only for promotion and tenure but in award nominations and VISA applications. Exciting and fitting role for the library.

In Planning the Plan: Collaborately Aligning Strategic Plan Initiatives and Assessment, Starr Hoffman (UNLV Libraries) provided us with a detailed look at the process she used with senior staff to ensure that the libraries’ assessment plan was in line with the strategic goals of the library. And as importantly, staff take ownership of those assessment activities.

In Why Measure That When We Need to Show This, Carl Grant (University of Oklahoma) provided the day’s wrap up. He spoke of the disconnect between the kinds of statistics we collect and libraries’ new roles. We need to be using metrics that align with what the university values. Oklahoma has created a Data Governance Committee that supports the work of bridging these data silos, including Institutional Reporting, IT, Libraries, Finance, Administration. Grant asks, “How do we create this culture of assessment?” and asserts that we need to “get in front of assessment. Part of change management is telling staff where they’re going to end up, how you will train them, and how you will make them successful.”

This recap does not do justice to the rich assessment work presented. I encourage you to explore the slides, freely available at: http://www.niso.org/news/events/2016/virtual_conference/apr20_virtualconf/


Posted in conference reports | Tagged , , | Leave a comment

Exploring Circulation Data: Who’s Checking Out What?

When I began as Collections Analysis Librarian at Temple last fall, I met with Subject Specialists to learn more about their work and to discuss how my work might help them. Several said they wanted to know more about how our library collection is being used. One librarian was curious to see how borrowing varies by user group, such as graduate students, undergraduates, or faculty. Several others wondered more generally if the items they order are getting used.

I had warned the Subject Specialists that I probably would not be able to immediately provide the information they were asking for, but that hearing from them would help me plan future projects. Usage was not only one of the most common metrics the Subject Specialists asked about, it was also the one for which I had the best access to data, as the Data Dashboard team had begun collecting circulation reports and information on user status before I started my position. One of the Dashboard Project’s goals is to provide metrics on library performance that allow Temple University’s Schools and Colleges to see how their constituents are using the library, and the data it contains can of course be relevant to us within the library as well. To answer my colleagues’ questions about usage, I began with data that others had collected for the Dashboard, and arranged it in a way that I thought would be most useful to Subject Specialists. I presented the data to a room full of librarians in February.

The Data

In the Data Dashboard, we have information on circulation transactions that includes the call number of each borrowed item and the status (graduate, undergraduate, faculty, ILL, etc.) and school of the person who borrowed it. For this presentation, I took a year’s worth of circulation data and added information on the subjects of the borrowed items. Using the call numbers, I mapped each item to a broad subject such as Art or Physics as well as a narrower subject like Drawing, Painting, Optics, or Thermodynamics. The mapping was based on the approval plans and the various call number ranges on each plan. This is more granular than the way the data is reported in the Dashboard, where it is sorted by college so that it can be reported to the colleges. For this audience, I wanted a more detailed look at specific subjects. The report I shared included 45 broad subjects and 380 narrower subjects.

With large tables, it can be hard to know where to start. I find it helpful to focus on a particular question so that I know which numbers to look at, and then make comparisons between numbers to see what stands out as unusually high or low. For instance, I suggested that one way to look at the data would be to pick a subject and ask if, within that subject, there are some sub-topics in which graduate students borrow more books than undergraduates and other sub-topics where undergraduates borrow more.

Some Examples of Findings

To take one example, Anthropology had the exact same number of books checked out by undergraduates as graduate students (318 each). There are more undergraduate majors than graduate students, but the latter probably borrow more books per student. Interestingly, though, the different groups of students seem to be borrowing books on different subjects. On ethnology, 27.52% of checkouts were to grad students compared to 10.32% to undergrads. For manners and customs, undergraduates borrow more books, making up 27.77% of checkouts compared to 10.66% for grad students. This might reflect a difference in the kinds of books found within each sub-topic. Books in the ethnology section probably contain more in-depth studies, which would be more relevant to graduate students, whereas books on manners & customs might be written for a more general audience. Looking at these numbers, therefore, not only tells us something about students’ needs but is also an inroad into understanding the sub-topics of a discipline.

Sometimes the checkout patterns raise additional questions about who is using the books. For Linguistics books, 34% of checkouts were to graduate students, although there are no graduate students in Linguistics. These numbers can make the case that books purchased for one program often benefit others as well. It is possible, for instance, that graduate students in Speech and Language Sciences are using Linguistics books.

Future Uses of Data

Most of the subject specialists who asked about usage statistics did not have a specific question but wanted to add to their general knowledge of the collection. Numbers can provide an entry point for looking at how our print collection is used, and this could prompt more specific questions about the curriculum, enrollment, or our holdings. The report I sent out after the presentation included the full list of titles that were checked out, so anyone who is curious about the usage of a particular section can dig deeper to see exact titles.

There are more questions that we will be able to answer with circulation data in the future.  For example, since we have information on what college the users are from, we could see whether some of the usage is coming from people we might not expect. Looking at undergraduates by year could show us if print monograph use increases as students progress through their careers. I had simplified the user information to make my presentation more digestible, but questions from the audience showed they would be interested in details. Another suggestion was to compare print usage to e-book usage for various subjects, which is also something I am starting to look into.

As the Data Dashboard comes together, I will continue to look for ways that the data can be useful to Subject Specialists, and I will of course have other collections analysis projects that serve this purpose as well. I hope this will be a beginning, with more information to come.

Posted in data-driven decision making | Tagged , | Leave a comment

An Assessment of the 2016 Strategic Planning Retreat

Assessment and strategic planning go together – we can’t assess when we don’t know what we’re aiming for. In that spirit, this post reports on the Library/Press 2nd Annual Strategic Action Planning Retreat, hosted by the SAWG16 working group.

The SAWG16 group includes Justin Hill, Lauri Fennell, Margaret Janz, Sara Jo Cohen, as well as myself and Steven Bell as co-chairs. The March 3 event, to which all staff were invited, drew a healthy number – 65 participants from 12 departments. The working group had three goals for the day:

  • Provide opportunities for staff members to get to know one another – not just in a social way but collaboratively –  working towards a library-wide goal
  • Learn about the ongoing strategic plan objectives for the current year – all that’s been accomplished so far
  • Begin brainstorming and defining potential objectives for the upcoming year

At the end of the day, we conducted an assessment of the Retreat itself. I will admit that even as someone who loves assessment I had some trepidation about soliciting feedback! I’ve organized enough conferences and meetings to know that for every one who loves the event there will be others with less positive things to say. But for the sake of continuous improvement we developed a quick evaluation form, providing the SAWG with excellent feedback and many ideas to consider for future events.

The Speed Idea Generation activity was the most popular. Participants had 5 minutes to brainstorm ideas about a question, like “What are ways we might foster more flexibility and support staff in developing new skills?” and “What new services could the library and press provide to help address the needs of faculty as they conduct and publish their research?”

We asked if participants found this to be worthwhile. Out of 38 responses, 100 % found the activity either very worthwhile or somewhat worthwhile (8). We thought it was fun, and it was gratifying to know that participants did too.

We asked how well the retreat met the outcomes stated above: getting to know other library staff members, learning about ongoing objectives, and thinking about future ones. Again, results were quite positive:

Response Getting to know other library staff members %
Very Successful 17 44.74%
Somewhat 17 44.74%
Neutral 4 10.53%
Grand Total 38 100.00%


Response Learning about last year’s strategic action objectives %
Very 15 39.47%
Somewhat 17 44.74%
Neutral 6 15.79%
Grand Total 38 100.00%


Response Helping me think about upcoming annual objectives %
Very 22 57.89%
Somewhat 12 31.58%
Neutral 4 10.53%
Grand Total 38 100.00%


The only way to improve is to listen to all the feedback, consider it with an open mind, and make adjustments for the future.  There was excellent, constructive feedback:

  • The lightning round, planned to update staff on progress towards our current objectives, should have provided more time for presenters and provided opportunity for all departments to be represented. And let’s get our microphone working.
  • We need to provide more food options at future staff retreats.
  • Some suggested shorter breaks – others felt the time spent was just right. Most of us enjoyed being in the Owl Cove, a few would have preferred to meet in the Paley building.
  • “I would love to see a problem solving section, where we can discuss problems staff see in the library in an open way, and brainstorm solutions”

And one of our favorite comments,

“I’ve been in many strategic planning meetings over the years and have never seen one end both early and burn-out free. Kudos to the team!”

All of this will be taken into account as future meetings for staff are planned. Thanks again to all who contributed.


Posted in organization culture and assessment | Tagged , | Leave a comment

Rush Reserves: A Collaborative Workflow Analysis

This last few months a team of library staff from Access Services, Cataloging & Metadata Services, and Acquisitions & Collection Development have been working behind the scenes to improve our process of Rush Reserves – ensuring that faculty and students have expedited access to course materials. The team included: Carla Davis Cunningham, Celio Pichardo , Lori Bradley, Judy Murphy, and Katie Westbrook.

Our initial approach was modeled after a LEAN process utilized at Drexel’s library. I wrote about that in another post on this blog. Temple’s plan had three goals:

  • Document a workflow that involves multiple departments in technical services in order to insure that process is as efficient as possible
  • Provide an opportunity for sharing knowledge across the departments
  • Engage staff in process that has potential for an improvement in service to patrons

On a big whiteboard, we collaboratively mapped out each step in this complicated workflow that includes tasks performed across three departments.  We scrutinized this workflow and discussed potential for streamlining, ultimately making some improvements in acquisitions workflow. The order and cataloging process are efficient, the less predictable variable is with the vendor.

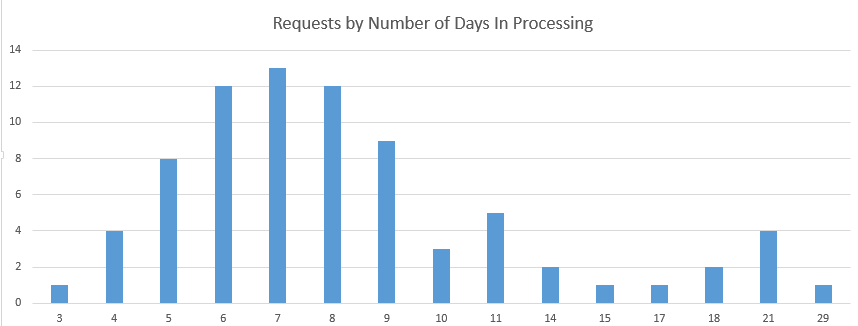
In a second assessment, we tracked 87 reserve requests that resulted in purchase during the Spring semester (2016). This exercise resulted in some good news and some less good news.

The good news. The average time it takes for an item to go from rush reserve request to “on shelf for check out” is 6-8 days. Over 64% of all items met this goal.

RushReserves

In the course of this workflow assessment we discovered a good portion of titles requested for course reserve, owned by the library, could not be found on the shelf.  Those specific titles were analyzed, and many appear to be textbooks, or recently published books about popular topics  (rap music). So perhaps the items have been hidden away for private use, or perhaps they’ve gone missing.  Since this was a select group of titles, we asked whether the problem was generalizable to the entire collection.

This question led to a third “phase” of assessment –  a review of an additional data source – 30,000 cancelled interlibrary loan requests, to determine the percentage of items cancelled due to not being found on the shelf.   Good news again. Only a small percentage of requests,  1.5 %, are cancelled due to not being on the shelf.

Through the efforts of the project participants, we made several improvements to the Rush Reserve process. Talking through the steps, with staff members from all three departments, makes visible each department’s contribution to this complex process. Mutual appreciation for the part each played in the process is re-emphasized. The exercise “allowed” staff to safely talk about frustrations in the process and work together to resolve issues of concern. While not as elaborate an assessment as the full-fledged “LEAN” approach, the collaborative documentation is proving to be an effective and not onerous (even fun) model for improvement.


Posted in process improvement | Tagged , | Leave a comment

“I Am the Content”: How and Why Instructors Discover and Share Course Readings

This post re-visits a project I blogged about several months ago. I interviewed Jenifer Baldwin (Head of Reference and Instruction Services) Anne Harlow (Librarian for Music, Dance, and Theatre) and Rick Lezenby (Librarian for Psychology and Political Sciences). They were in the preliminary analysis stage of qualitative research for which they conducted 10 structured interviews with faculty members from as many disciplines. Their goal: to learn more about how and why instructors choose and share content with their students.

They had the opportunity to present their work to a national audience January 12 of this year as part of an OCLC webinar series.  A recording of that session and the slides are now available.

IAmContent

The interviews revealed how the faculty experience of discovery is rooted in their self-identity as readers and experts, and is something they aim to model for their students.  The results from these interviews may suggest ways for libraries and publishers to influence what content faculty select and integrate into their teaching.

Scholars look at the world with a lens through which they are always on the look out for source material. A New Yorker cartoon, a graph, poetry – much of the content they incorporate into their assignments is not necessarily library material. A researcher needs a good deal of content knowledge for this serendipitous type of discovery to make sense, whether it is browsing the vast stacks at the library or perusing a bookstore. Faculty may also utilize personal networks of fellow experts, the “invisible college”, to pull together course material.

One of the surprising findings to the research team was that undergraduates are expected to read very broadly, where as graduate students  focus their research and reading in a different way. It’s assumed, perhaps, that advanced students have done the contextual reading and their task is narrow their research. For undergraduates, print handouts distributed in class are privileged over resources posted to online course management tools like Blackboard. This ensures that students will really pay attention to what the instructor wants them to learn.

One of the most exciting aspects of this research is its potential for informing librarian practice. Rick says, “I listen more closely to the student”.

Jenifer’s practice is also changing.  She says, “I am thinking about different ways in which we can support the work of students in their classes. For instance, rather than spend instruction time demonstrating how to search a database, I provide students with a screenshot of search results; we look at those and discern together how to evaluate those results.  What are the clues? Then we look at the abstract to dig deeper into understanding.  Finally, I ask students to underline critical clues in the first page of the article, to see what more is there.”

A practical implication for libraries: Liaison librarians are well-positioned to provide much needed support for teaching faculty, providing timely, highly-relevant content in digestible, mashable components that teachers can easily incorporate into their instruction content.  A kind of “buzzfeed for teaching”.


Posted in instruction and student learning, qualitative research | Tagged , | Leave a comment

Notes from the Field: ALA Midwinter 2016

The ALA Midwinter meeting came early this year – seems like we’d just returned from winter break when it was time to prepare for Boston.

FullSizeRender(2)

Data, data visualization, and assessment have become popular topics of discussion and ALA sponsored more meetings than I could attend without the help of a horse to transport me from place to place. Here are some highlights:

Assessment Findings Repository

We kicked off an important initiative for assessment at a visioning and planning meeting for a potential Library Assessment Repository. The Repository project is just in its planning stages, spear-headed by Jessame Ferguson (McDaniel) with two sections of LLAMA (Library Leadership & Management Association): MAES (Measurement, Assessment and Evaluation) and LOMS (Library Organization and Management).

The impetus for a repository is the value of centralizing across libraries assessment data and findings, as well as samples of instruments and methodologies. Currently this kind of resource is silo-ed on library websites and intranets. We lose expertise, research already conducted, and potential for peer comparisons, when this data are not in a shared, collaborative space. Creating and sustaining a repository such as this would be a challenge, particularly if raw data about library use is made public, but definitely worthwhile.

ACRL Assessment Discussion Group

Patron privacy was also a topic the next day at the ACRL Assessment Discussion Group I convened. The meeting was well-attended by a good mix of librarians and researchers and we had a lively discussion related to assessment in libraries. What particularly struck me was the increasing use of new data collection methods, including card swipes and wi-fi tracking systems to get more detailed behavioral information: Who is in our building? Where are they going? The balance of privacy and usable data for demonstrating value came up more than once in this wide-ranging discussion. Let me know if you’d like notes to the meeting, also posted at ALA Connect.

Ithaka S+R

I attended the Ithaka S+R participants meeting, as Temple will be involved soon with one of their sponsored projects on how faculty do research in the discipline of religious studies. If you aren’t familiar with this organization, I encourage you to take a look at the newly designed website – much of their research on libraries is open access – see for example a landscape review of  where  digital scholarship is placed in large research libraries. In the upcoming year, Ithaka’s research arm will focus on education transformation and libraries & scholarship communication.

LLAMA MAES Hot Topics

The hot topics sessions sponsored by LLAMA MAES are always at the forefront of what libraries are doing with measurement, assessment and evaluation.  Lisa Horowitz, MIT, discussed the assessment of their outreach to new faculty. The starting place was an agree-upon set of principles, or best practices,  that librarians would all use in their liaison work. For instance, conducting research on the 40-50 new faculty members coming to MIT each year. The outcomes that were measured included a number of face-to-face meetings and an increased knowledge by faculty members of library services – both for faculty research and their students. The results have not yet been published, but this is sure to be a provocative, but practical analysis.

Other ideas and projects described by participants:

  • Using Zotero to create faculty profiles
  • Adding information on outcomes to data input for reference transactions
  • Mining monograph acknowledgements for references to librarian research support

The general thread, and one I heard multiple times over the course of the conference, was libraries using assessment and data in order to create more effective, yet meaningful ways of telling the Library’s story.


Posted in conference reports | Tagged , | Leave a comment

An Assessment Librarian Reflects on 2015

It’s the new year, and a time of reflection. As for me, I’ve been thinking about this ‘new position (relatively) at Temple and changes since I began in 2014. I love what I do, and here are some of the reasons why.
Assessment is about asking questions.  We are always asking why. Data is not the answer, it merely prompts us to ask more questions. Assessment is about growing an organizational culture at the Library that encourages the sharing of our expertise and insights as well as the data we collect. We don’t take our value for granted and we are willing to change to improve services to our users.
Assessment affords us an opportunity to be transparent in our decision-making. This isn’t always the case, of course, but we do use data to help us understand technology use and profile our technology offerings based on that, or determine the best hours to service public desks and how.
Assessment is about building a technical infrastructure that will allow us to learn more about how our users connect to the library. This has been a long and complex technical challenge, but here at Temple we are able to connect demographic data from Banner (user status, college) with transactional data (circulation, interlibrary loan, use of computers and Ezproxy), to improve our understanding of how scholars from different disciplines use library services and resources.
Assessment is about continually learning new technologies and skills, from a less-used Excel formula to regular expressions to SQL. More importantly, for me anyway, it’s learning how to talk the language of technology colleagues so we can most effectively work together.
Assessment is about partnering with all the departments in the library, as well as with external units on campus like IT, Institutional Research & Assessment and the Institutional Research Board.
It’s about helping to develop a community of practice in the Philadelphia area – colleagues at Penn, at Drexel, Bryn Mawr, Philadelphia Community College and the many others who contribute to our PLAD meetings. In this blog I have had the opportunity to profile numerous meetings and conferences on library assessment, regionally as well as nationally.
The  job is never dull and varies from qualitative research projects to working with colleagues on the strategic planning retreat.  A recent workflow analysis pulled together staff from three departments to improve our process for rush reserves. This process of collaborating toward a common goal was instructive for all of us and will result in improved service for faculty and students.
Slowly but surely, we are indeed building a culture of assessment here at Temple Libraries and beyond.  Diane Turner, curator of the Blockson collection said to me recently, “I think about assessment every time we have an event.”  Thanks for that small indicator of change!
Here’s to a new year with more insights and improvements in the service of the Library’s users.
Posted in organization culture and assessment | Tagged | Leave a comment

Assessment Drives Decision-Making Process for Health Science Library’s Technology Offerings

Last year I profiled Cynthia Schwarz, Senior Systems & Technology Librarian on her assessment of computer use at the Ginsberg Health Services Library. She was using the software LabStats to analyze the use of computers at the library – the software allows us to understand not only the frequency of computer use and where those highly used computers are located, but the school and status of our computer users.

This year she’s taking her efforts further, using this data to improve technology offerings and saving student money along the way.

NT: What was your question? What are you trying to understand?

CS: We know that technology needs are constantly changing. The Library currently provides over 150 fixed computer workstations, 65 circulating laptops and 32 study rooms equipped with varying levels of technology.

We had anecdotal evidence, based on observation, that not all our computers in the Library were being used. I wanted to understand more about what technology is used and how heavily – so we don’t replace less used equipment unnecessarily. That’s expensive and we could deploy those funds elsewhere, serving students better.

NT: What kind of data are you collecting?

CS: The Library has been collecting statistics on the use of library-provided technology since 2014. These data include the number of logins to fixed workstations, the number of loans for each piece of equipment, including laptops and iPads, and the number of print jobs sent to the student printers from fixed workstations and from the wireless printing service. As the hardware comes up for replacement, this collected data serves as an important road map in making decisions about what to replace.

I wanted to use statistics to assess the need for replacements of all this equipment. For instance, in the current fiscal year, 44 public iMac computers were up for replacement. Based on the data collected, no more than 21 of the 44 computers were ever in use at the same time. I determined that some of the iMacs could be eliminated without a felt impact to students.

But, we couldn’t simply remove computers at random. We looked at the specific machines that were used and where they were located.

iMac heatmap-cropped

The heatmap shows pretty clearly that there are “zones” in the library, the 2nd floor, for example, where the computers were less used. These were the computers by the stairway, as well as computers inside of cubicles. In this area, students were more likely to use their laptops at bigger tables.

In the end, we reduced number of iMac workstations from 44 to 27, saving the library $32,900 in the first year and $2,700 each year after.

NT: Do you have any other assessment plans related to technology use?

This example is just the first piece of a much larger puzzle of making decisions based on data to determine how resources should be allocated to best support students moving forward. Throughout the spring 2016 semester, the library plans to review the fixed PC workstations, the study room technology and the laptop and iPad loaners.

The second step is to consider how to re-deploy those resources, i.e. money saved from hardware replacements. The Library is now able to invest in different technologies such as Chromebooks, 3D printing and scanning and specialized computers with high-end software.

NT: How do you learn about what those new technologies should be?

Because of its size, the health sciences library is a perfect testing ground for new technology offerings. We stay current with what other health sciences libraries are doing, we carefully analyze our usage data, and we talk to students.

NT: Thanks, Cynthia. Your work is a great example of using data to inform decision-making. This kind of analysis could be applied at the other library locations too – I imagine the technology use profiles at Paley, Ambler or SEL would look quite different —  that would generate some interesting questions too.

Posted in data-driven decision making, technology use | Tagged , | Leave a comment