By Angele M. Cirucci
(Posted on behalf of Peter Logan, Director, Center for the Humanities at Temple)
In Spring 2015, I taught an Honors course on the Digital Humanities (DH) for undergraduates and discovered two things:
(1) Students had no idea what DH was;
(2) Despite all the work involved, students loved the experience of creating their own DH projects.
In this note, I summarize some of the discoveries of teaching my first DH class at Temple. I designed the course to begin with concepts common to all DH work (databases, classification, and data visualization) before moving on to look at the different branches of the field: textual/visual analysis, GIS, timelines, and networks. Students then worked in teams to produce their first DH project, using these tools and concepts, instead of writing a final paper.
Skills and Concepts
Learning basic skills was made much easier because of the workshops developed by library staff (Matt and Angela). Hands-on workshops let students explore the technology involved, learning Omeka and Voyant, Twitter scraping with NodeXL, and how to do basic GIS. Others, like creating charts using Google Fusion, were integrated into the course with briefer workshops.
These skills were combined with essays about fundamental concepts they needed to think about. What visual principles are involved in representing data? (Edward R. Tufte’s work is unmatched.) What are the pitfalls of data classification? (Foucault’s Order of Things worked wonders.) How does the form in which content appears change its meaning? (Marshal McLuhan’s “Medium is the Message” is old but still provokes.) So the course was a mix of conceptual work and practical workshops. While students did not always understand why they were reading some of the denser pieces, most said the light dawned when they got into the intricacies of their final projects.
Final Projects
With only a single semester, I had to limit the range of possibilities for their projects, to keep them focused on the work, and so I had them develop research questions that could be answered by making original use of anything in the library’s Digital Collections and Digital Exhibitions as their source material. Initially, students wanted to create projects from their own interests using anything on the web, but the library collections had two things going for them: they are well-curated and relevant to Philadelphia. That first aspect meant that students could concentrate on designing a research question rather than spending weeks trying to gain access to suitable materials. The last aspect proved deeply appealing to some undergraduates, who learned about the social history of the city in the course of their projects.
Two Groups
Students formed into two groups for the final projects, and they brought an astonishing amount of creativity and focus to the work.
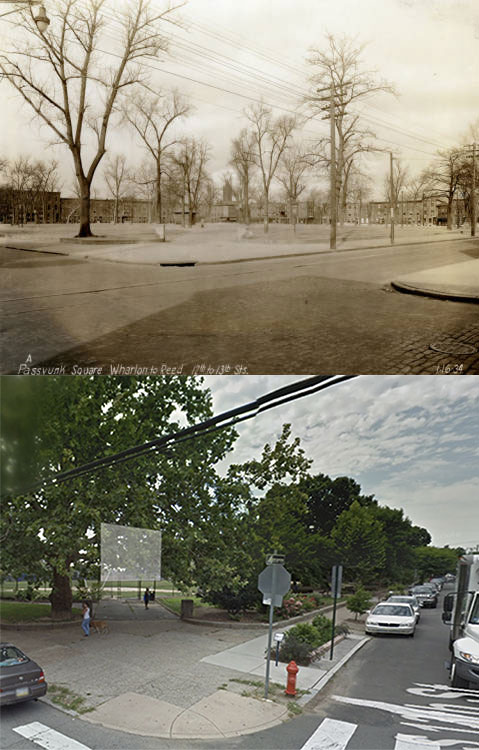
The first group used historical images of Philadelphia parks from the City Parks Association Photographs collection to explore the nature of change experienced by the smallest parks in the 60-100 years since they were taken. Did they get better? Worse? Did neighborhood income matter? Using recent images of the same parks from web sources, they were able to construct a before-and-after series of comparisons that let them document visual markers they identified as significant: was the park still there? Were there more or fewer plantings? What about structures? Trash?
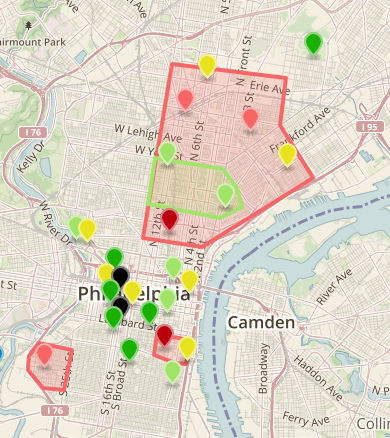
Plotting their images on a map, they were able to visually represent the state of different parks across the city, and discovered that the reality was far more complex than they had imaged, going into it.
To me, there’s no better lesson to learn about social research than this one for beginners.
(Read about Peter’s second group in “Introduction to Digital Humanities Course, Part 2.“)