By Angele M. Cirucci
(Posted on behalf of Peter Logan, Director, Center for the Humanities at Temple)
(Read Part 1 of Peter’s post here.)
The second group had more members and produced a project with more modes of analysis. KIDSNET contains instructional materials by the major networks for their children’s programming. Students wanted to know: how had representations of race, gender, and violence changed in the lifespan of the collection, 1984-2010? Focusing on 41 of the collections 111 materials, they developed two complementary modes of analysis. They did a textual analysis of the written material using Voyant to discover word frequencies for gendered terms, racial or ethnic markers, and works indicating violence.
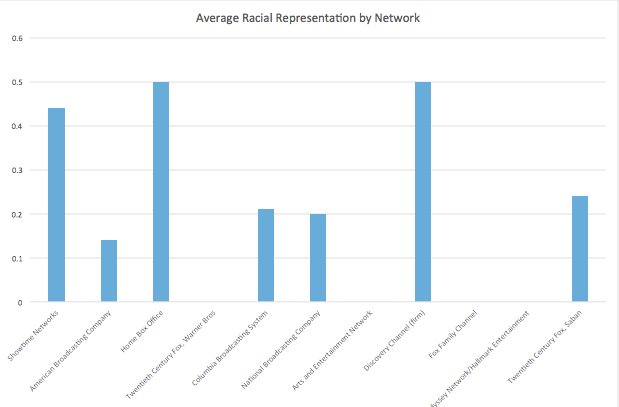
Using Sentiment Analysis, they were able to differentiate positive and negative uses of the terms. Other group members did a visual analysis of the images, using a codified scheme to identify the difference between visual references to girls and boys, for example. Bringing both visual and textual analysis together allowed students to make claims not just about trends over time (references to girls actually decline during the time period), but to differentiate trends with networks (Discovery Channel was by far the most lopsided, with almost no girls at all, for example).
Interdisciplinary and Collaborative Learning
The students in the course represented an unusually heterogeneous set of majors, including the sciences, social sciences, humanities, and arts. This meant that all had different perspectives on the nature of scholarship. While initially I thought this was a difficulty to overcome, I quickly learned that it represented a strength. Why? Students loved the opportunity to compare their own (relatively young) perspective to those of others, because it allowed them to see their basic assumptions with new eyes. Interdisciplinary work can do that, at its best moments, and the undergraduates were particularly open to the new experience.
The heterogeneity made sense to them as a natural product of DH work. While knowing nothing about it at the outset, they liked the idea that it was a multifaceted form of scholarship, and one that required collaboration among people with different skillsets in order to succeed. The classic DH project involves a research question about products of human culture (historical events, media, literature, antiquity) and brings together humanist scholars, programmers, designers, and information science specialists. To these undergraduates, DH meant everyone gets a seat at the table.