
Folium is a Python package built to bridge the data wrangling muscle of Python with Leaflet’s easy-to-use JavaScript library for creating attractive, interactive web maps. The open source Leaflet is a highly popular web mapping tool due to its flexibility, with a healthy number of community-developed plug-ins further expanding its native capabilities. While Python is a robust programming language, with many packages contributing to geospatial analysis– Pandas, GeoPandas, Fiona, Shapely, Matplotlib, and Descartes to name a few– Folium differentiates itself through ease of use and the interactive potential of the final product. After some experimentation with the library, it did not take very long to produce a functional, albeit simple, web map with clustered point data, accompanied by popup windows. However, it was obvious that there is more to explore with Folium, as it plays well with many types of geospatial data, includes built-in functions and methods for producing choropleths, temporal visualizations, and allows for the marriage of the best of Python and Leaflet.
The code and resulting maps show a straightforward exercise in extracting the geographic coordinates (already matching Leaflet’s default web-mercator projection) and a few attribute values corresponding to warehouse/distribution centers in Pennsylvania’s Lehigh Valley from an excel spreadsheet. The Pandas library was used to read the excel document and convert the desired information to a dataframe. Folium was used to initialize a Leaflet map, add records as points with some stylization applied. This is brief code that could easily be added at the end of a more intensive spatial analysis using Python. It can provide a quick way to publish results in an interactive format without necessitating the use of JavaScript/html/CSS, or could serve as a jump start on more elaborate styling.
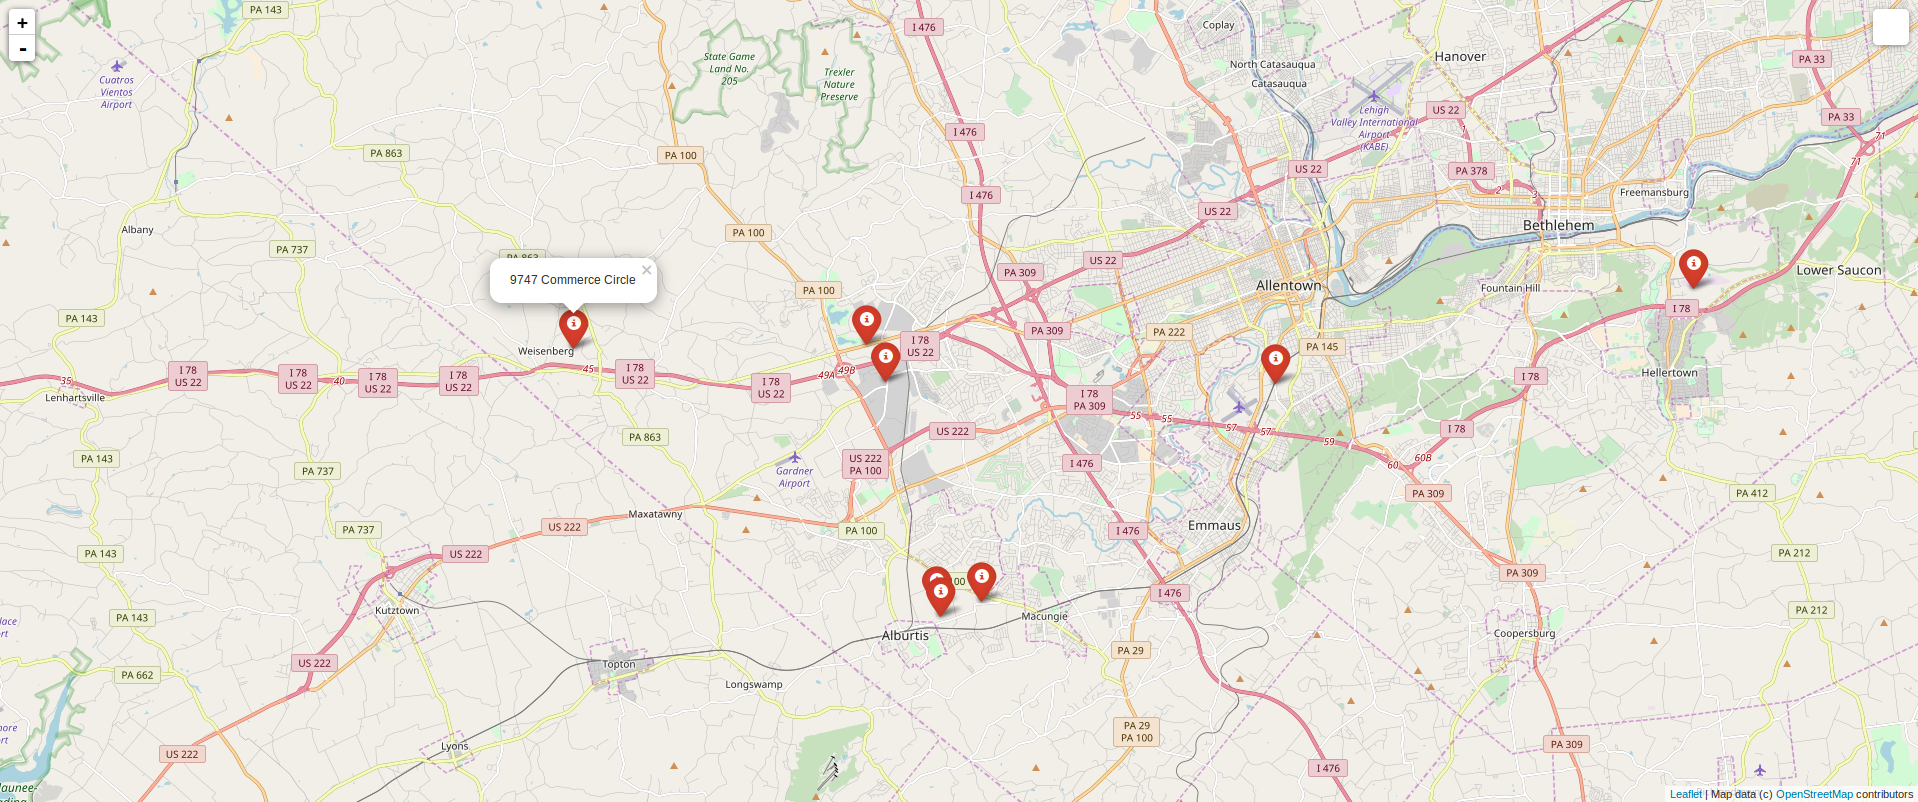
Map #1 – Mostly default styling
import pandas as pd

import folium
import folium
#converting the imported data to a pandas dataframe object
df = pd.read_excel(“Warehouses.xlsx”)
#identifying the long, lat columns, and other properties for the popup window

df.head()

pdlat='Latitude'

pdlon='Longitude'
df.head()
pdlat='Latitude'
pdlon='Longitude'
#removing unwanted columns

avail =df[3:]
avail =df[3:]
#initalizing folium map object as m and using the geographic mean of the data points to center the viewpoint; basemap defaults to OSM

m=folium.Map(location=[df[pdlat].mean(), df[pdlon].mean()], zoom_start=12)
m=folium.Map(location=[df[pdlat].mean(), df[pdlon].mean()], zoom_start=12)
#Iterate through edited dataframe to extract coordinates and property name for each record

for row in avail.iterrows():

prop = str(row[1]['Property'])

lat = row[1][pdlat]

lon = row[1][pdlon]
for row in avail.iterrows():
prop = str(row[1]['Property'])
lat = row[1][pdlat]
lon = row[1][pdlon]
#attach each record to a default marker style based on coordinates and add property name to popup window

m.simple_marker(location=[lat, lon], marker_color='red', popup=prop)
m.simple_marker(location=[lat, lon], marker_color='red', popup=prop)
#outputting html document with code for an interactive map to working directory

m.create_map('map.html')
m.create_map('map.html')
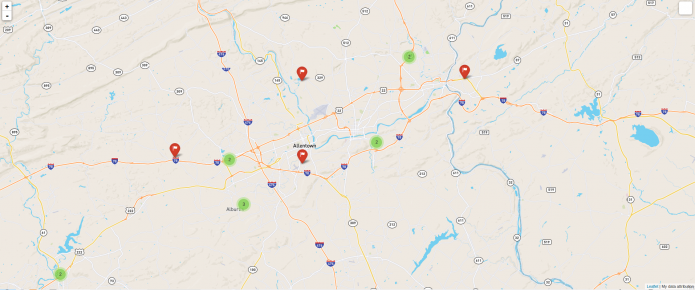
Map #2 – Custom MapBox Tiles, Clustered Markers, Different Icon Imagery
Only showing code that differs
#Generate map using custom Mapbox tiles

m=folium.Map(location=[df[pdlat].mean(),

df[pdlon].mean()], zoom_start=9,

tiles='https://api.mapbox.com/styles/v1/username/yourstyle/tiles/256/{z}/{x}/{y}?

access_token=pk.yourtokenhere',attr='My data attribution')
m=folium.Map(location=[df[pdlat].mean(),
df[pdlon].mean()], zoom_start=9,
tiles='https://api.mapbox.com/styles/v1/username/yourstyle/tiles/256/{z}/{x}/{y}?
access_token=pk.yourtokenhere',attr='My data attribution')
#Iterate through edited dataframe to extract coordinates and property name for each record
for row in df.iterrows():
prop = str(row[1][‘Property’])
lat = row[1][pdlat]
lon = row[1][pdlon]
#used the marker_icon argument to select from natively supported bootstrap supported icons and added clustering affect to markers
m.simple_marker(location=[lat, lon], marker_color='red', marker_icon='flag', clustered_marker=True, popup=prop)
