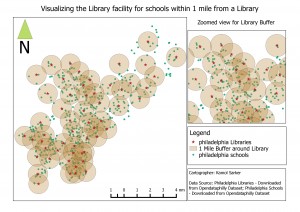
There are about 550 schools and total 55 public libraries in Philadelphia. From all US small and largest cities, Philadelphia has one of the highest crime rate (44 per one thousand). This project tries to determine the risk for students when they want to go to the nearest public library. It also determines how many schools are in one mile from each library that will show how the libraries are unevenly distributed into the city area or the public libraries did not consider the number of schools around it when they established. This also shows where the schools and library and how many crimes happened around each school and library. So, this will predict the possibility to become a victim with the neighborhood crimes. To do this, I have used PostgreSQL which is easier to calculate and measure the risk on the way from a school to a closest library.
I used three important data sources such as school data as .csv, library data as a shapefile and the crime data that shows all the reported crimes that happened in Philadelphia from 2007 to 2014. All these data are acquired from OpenDataPhilly which is a open data source. After download all the necessary data performed a data normalization to reduce the data redundancy. To use these data with PostgreSQL, need to upload in the SQL server (for the shapefile use the shp2pgsql command and for the .csv file use the simple SQL console). The map below shows the location of schools and libraries, crime incidences around one mile of each schools and the numbers of schools within one miles from each public libraries.
After applying some quarries, I have found that there many schools where more than 2000 crimes happened and there are three schools where more than 5000 crimes happened within 1000 feet, and there are 5 libraries where more than 2000 crimes happened in those 7 years. The libraries are unevenly distributed around the city depending on the number of schools. There some libraries in which there are only one school, and there are two libraries where more than 20 schools within one mile. Even there are some schools that are more than one and half miles away from the closest libraries. The figure below shows the lines between the schools and the closest libraries with hundred feet buffer around the lines.
CREATE TABLE phl.shortest_distance_buffer AS

SELECT e.from_school, e.close_library, ST_Buffer(geom,100)::geometry(Polygon,2272) AS geom

FROM (

SELECT d.school as from_school,

d.library as close_library,

ST_MakeLine(d.geom1, d.geom2) as geom

FROM(

SELECT

s.facil_name AS school,

s.geom AS geom1,

A.branch_nam AS library,

A.geom AS geom2,

ST_Distance(s.geom, A.geom) as distance

FROM

phl.all_philly_school as s

CROSS JOIN LATERAL

(

SELECT l.branch_nam, l.geom

FROM phl.philly_libraries as l

ORDER BY l.geom s.geom

LIMIT 1

) AS A) as d) as e;
SELECT a.from_school, a.close_library, count(b.objectid)

FROM phl.shortest_distance_buffer as a

JOIN phl.philly_crime_incident_coded as b

ON ST_Contains(a.geom, b.geom)

GROUP BY a.from_school, a.close_library

ORDER BY count(b.objectid);
The above queries, I have use to make a straight line between each school to the closest libraries and make a 100 feet buffer around the each line. The bottom part of the query count crimes in each buffer. The intention of doing this is to determine the number of crimes happen in each buffer line and to find out the possibility to become victim if a student want to go to the closest library from school. The result of this query shows that there are 14 line distance from schools and libraries where more than 650 crime happen from 2007 to 2014. Therefore, it is more likely to become a victim with the neighborhood crimes than other 531 line distances from schools to libraries. Alternatively, there are 12 line distances between schools and closest libraries where less than 10 crimes happen from 2007 to 2014.
There are some limitations in the project like the straight lines that created between schools and closest libraries are not the route to get to a library, so, the crime calculations are not right just an assumption. Also, at the time of crime calculation I did not concern the time of crime, and the student’s intending time to go to a library. It is important to consider the time of crime and the intending time for a student to go to a library to make a rational estimate of crimes (including the type of crime) that happen into the buffer areas. Depending on the limitations, the further research can be done in which the researcher can use the PG Routing to get the exact routes with distance between a school and a closest library and connect that result with the crimes considering the time and type of crimes to make an potential report to see the possibilities of becoming a victim by a neighborhood crime when a student intended to go to a library. The research can also find the alternative routes and day time where and when (safest way and time) has very less possibilities to become a victim by the neighborhood crime.
For project detail contact email: kamol.sarker@temple.edu


