By Huilin Zhu
My digital project’s research question explores how the built environment affects people’s health, especially in terms of weight, in the state of Pennsylvania. In order to consistently measure the built environment’s effects, I’ve previously worked to download satellite images from Google’s static. My first blog introduced how to use python and Google static map API to downloaded all the tile images. I put the image together based on census tract, import all these images, and convert each image into a 3-dimensional array in python.
The next step is to use a pre-trained Convolutional Neural Network (CNN) model to extract features of the built environment from satellite maps. To run a deep convolutional network for object recognition, I’m using a model trained over ImageNet’s dataset developed by Oxford’s renowned Visual Geometry Group (VGG). My previous blog “Measuring the Impact of Built Environments on Health Part II: Use of transfer learning” discussed why and how I use the VGG model as the pre-trained model to extract the features of the built environment. In this blog, I will focus on how to use Python to apply the VGG16 model to do transfer learning.
Installation
I downloaded TensorFlow and Keras to implement VGG. It’s better to upgrade pip before you download TensorFlow and Keras.
pip install --upgrade pip
pip install tensorflow
pip install keras
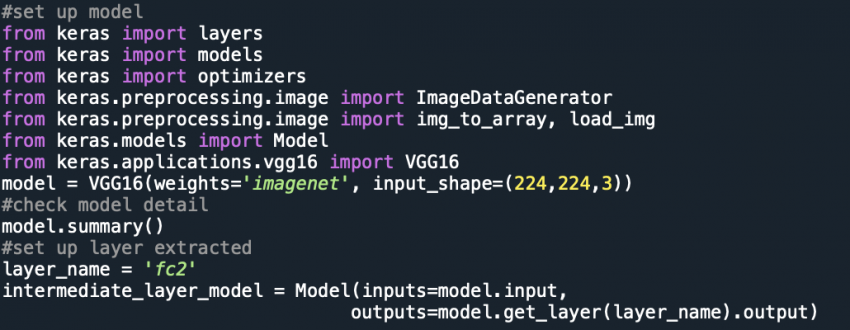
Set up a model
Keras provides both the 16-layer and 19-layer version via the VGG16 and VGG19 classes. My study uses the VGG16 model. VGG16 is trained over ImageNet, and the images in ImageNet are classified into animals, geological formation, natural objects, and many other different categories. The input images I am using are Google’s satellite images, including images of parks, highways, green streets, crosswalks, and housing. Since there are some differences between the input data image in the pre-trained model and the input image data, I will use the second fully connected layer instead of the final layer-predictions.
The model can be created as follows:
from keras.applications.vgg16 import VGG16 model = VGG16(weights='imagenet', input_shape=(224,224,3))model.summary()
My project uses a second fully connected layer of the VGG-CNN-F network to extract the information of the built environment. If you want to check what kind of exact objects exist in the image, you should use prediction as to the extracting layer. The following code shows how I use the second fully connected layer ‘fc2’ to extract the information from each image.
from keras import layers
from keras import models
from keras.models import Model
layer_name = 'fc2'    #set up layer extracted
intermediate_layer_model = Model(inputs=model.input,outputs=model.get_layer(layer_name).output)
Extract the feature of the maps
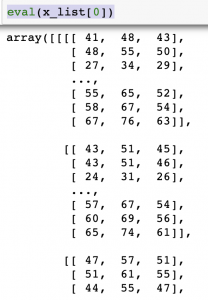
All images are loaded and converted to 3-dimensional arrays in Python. Each item in x_list includes all the Numpy arrays in one specific census tract. For example, x_4202000-42077001800 represents a list containing all the arrays in the census tract with 4202000-42077001800 as Place_tractID. Using the function of eval(x_list[0]), we can see all the NumPy arrays for each image in the first census tract in Allentown.
The following code shows how to implement the VGG pre-trained model to extract the features of the built environment in each census tract.
data_sum = [ ]
for i in x_list:
k = [ ]
#get 4096 variables for each image
createVar['layer_output_' + i] = intermediate_layer_model.predict(eval(i))
# get the mean value for the 4096 variables for all images in each census tract
createVar['mean_' + i] = pd.DataFrame(eval('layer_output_' + i)).mean(axis=0)
k = eval('mean_' + i)
k['Place_TractID'] = i
if len(data_sum) == 0:
data_sum = k
else:
data_sum = pd.concat([data_sum,k], axis=1, ignore_index=True)
data_sum  # show the results
Finally, I can get 4096 variables for each census tract in data_sum. The following table is part of the output of data_sum.
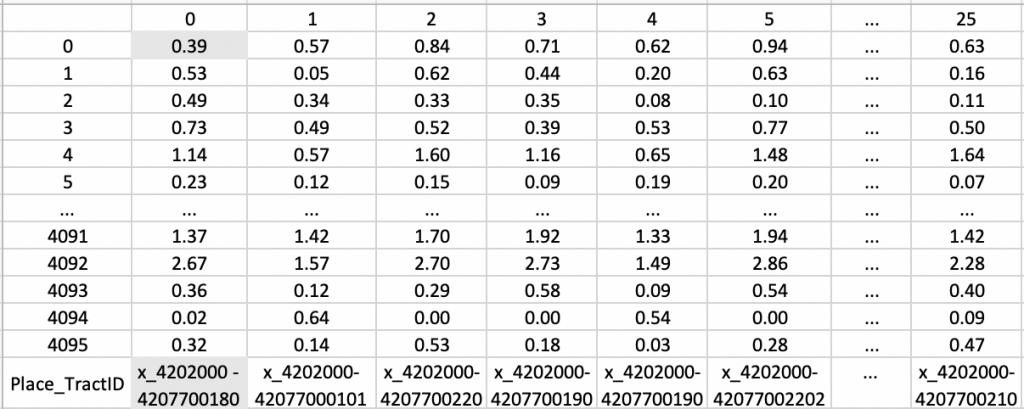
The first column is the index and another 26 columns representing each census tract in Allentown. The last row of the table shows the Place_TractID for each census tract. Each Column contains 4096 variables that can represent the feature of the built environment in each census tract.
For example, x_4202000-42077001800 is the place tract ID for the first census tract. The value of the first variable in the first census tract is 0.39. The value of the variable 4096 in the first census tract is 0.32. These 4096 variables do not have a specific meaning, but they can represent the indicator of the built environment, including color, gradient, edge, height, length, etc.
Future Research
Right now, I get 4096 variables for each census tract in Allentown. Allentown only has 26 census tract, which makes the sample very small. I will download the satellite image for the main cities in Pennsylvania, get all variables for each census tract. Then I will combine the 4096 variables with the overweight percentage level in each census and do statistical analysis. Other control variables may also be taken into accounts, such as median household income, percentage of male(female), and percentage of the race (White, Black, Asian, and other race), percentage of households under the poverty line.