By Kaelin Jewell
At the end of last semester, Gary Scales (Ph.D. Student in History at Temple) led a workshop on the basics of QGIS, the open-source desktop GIS program. Although familiar with QGIS from a project Danielle Abdon was working on last year, I had steered away from it thinking that it was too complicated for someone in the midst of writing a dissertation and the barrier of entry would be too high to create the types of maps I envisioned for my project. Well, I was wrong! Once I got past my fear of the unknown and downloaded the program onto my computer (it’s available across platforms–a plus), I quickly realized that I could make maps that were infinitely more useful than those I had made with programs such as Google Maps and CARTO.
Although both of these programs create dynamic and visually stunning maps, their reliance on modern basemaps was problematic to me as a scholar of the ancient and medieval worlds. I didn’t necessarily want to plot locations on a modern map of the Mediterranean–I wanted to visualize my data within the geographic context of the later Roman Empire and onto a map that reflected that reality. This is where QGIS, which allows you to create and utilize your own basemaps from open-access shapefiles (among its other helpful aspects), comes in handy.
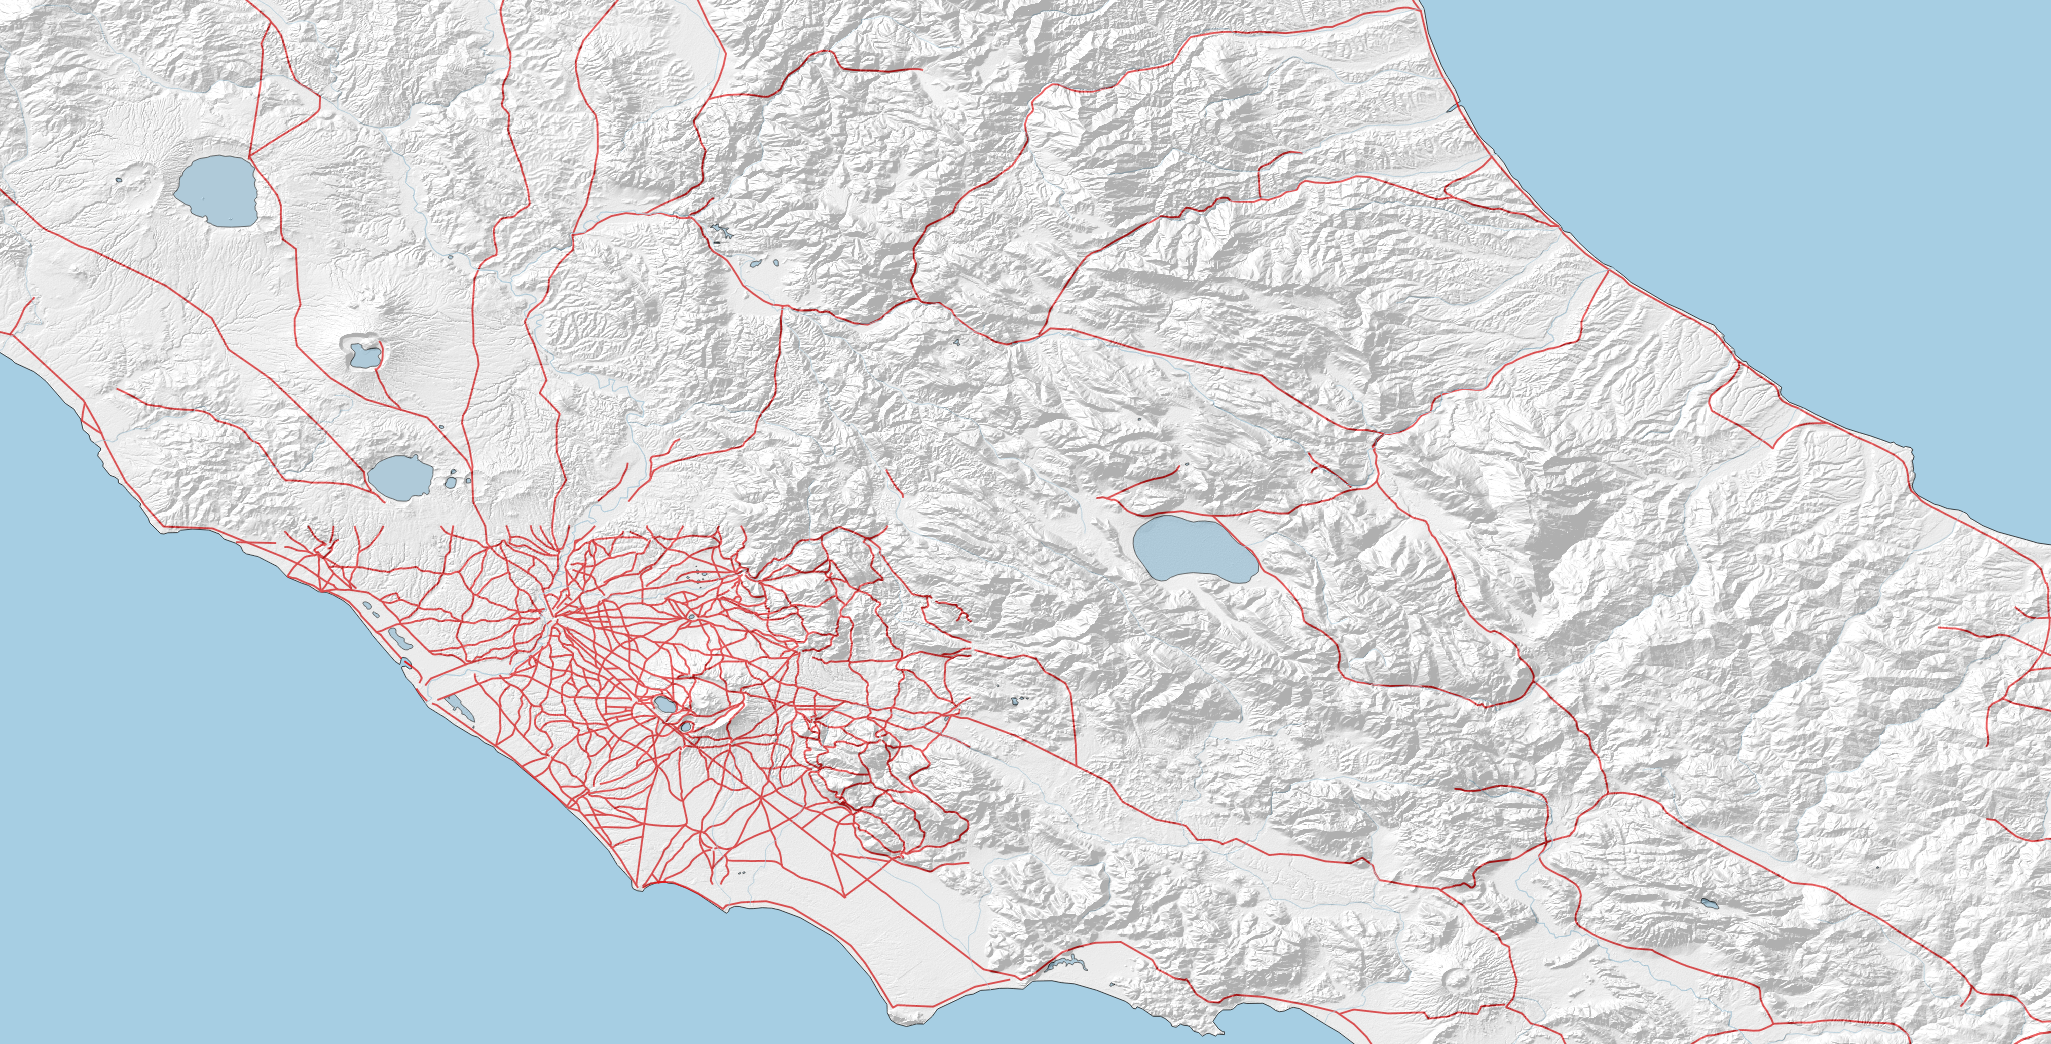
What follows will serve as a step-by-step quick-start guide for creating a QGIS map of the ancient Mediterranean using the open-access shapefiles found at the Ancient World Mapping Center (AWMC).
1. Download and Install QGIS: Available on Windows, MacOS X, Linux, and Android; current version is QGIS 2.18.3 (Released on 01/13/2016)
2. Download Shapefiles from the AWMC: Index of AWMC map data – http://awmc.unc.edu/awmc/map_data/
It is important to remember that shapefiles are a form of vector data and should be saved in a project folder with that designation, to avoid any confusion down the line. Also, when downloading these shapefiles, be aware that you will have to download “sets” of files for each vector data layer: .shp (shape format), .shx (shape index format), .dbf (attribute format).
To create a map of the ancient Mediterranean similar to the one at the top of this post, you will need to download several different sets of files, found in a few different places on the AWMC index of map data:
Coastline data: http://awmc.unc.edu/awmc/map_data/shapefiles/physical_data/coastline/
River data: http://awmc.unc.edu/awmc/map_data/shapefiles/physical_data/ba_merge/
Inland water data: http://awmc.unc.edu/awmc/map_data/shapefiles/physical_data/inlandwater/
Open water data: http://awmc.unc.edu/awmc/map_data/shapefiles/physical_data/openwater/
Roman Road data: http://awmc.unc.edu/awmc/map_data/shapefiles/ba_roads/
3. Download Elevation/Hillshade Data:
Unlike the shapefiles above, elevations are a form of raster data and often take the form of .tif files. For this map, you’ll need to download carte_hillshade.tif file found here: http://awmc.unc.edu/awmc/map_data/elevation_data/
3. Upload vector (shapefiles) and raster (elevation) data into QGIS:
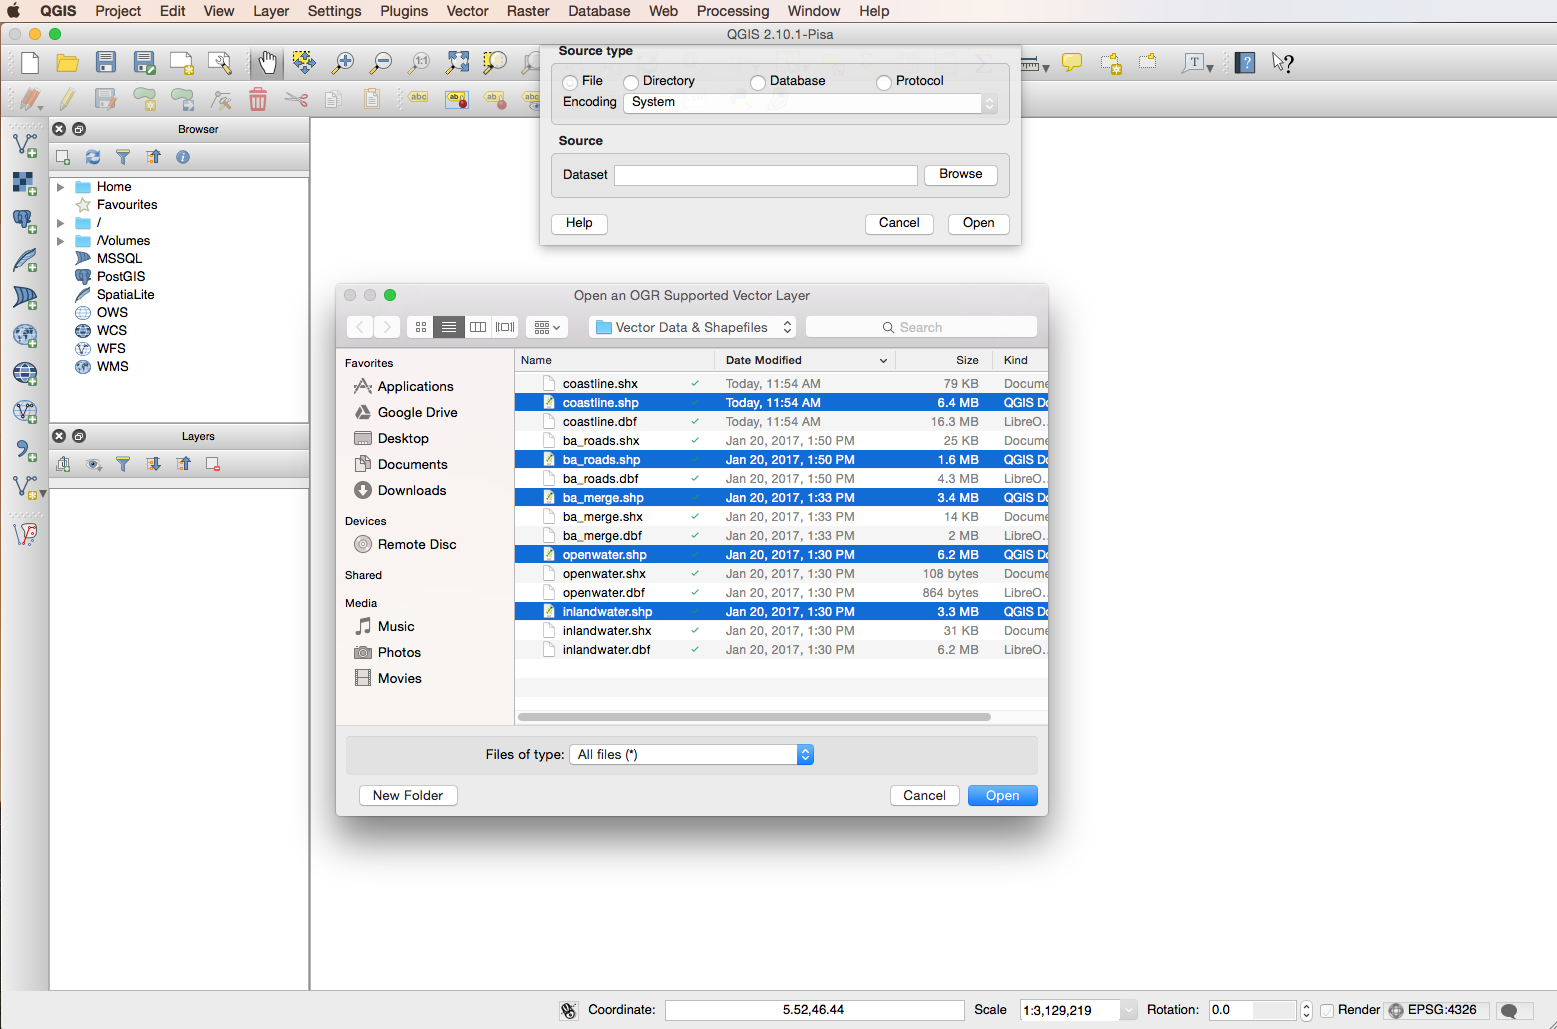
Although you downloaded multiple sets of files for each type of shapefile, you will only need to upload the ones designated with the .shp ending.
Vector Data Upload: Layer > Add Layer > Add Vector Layer
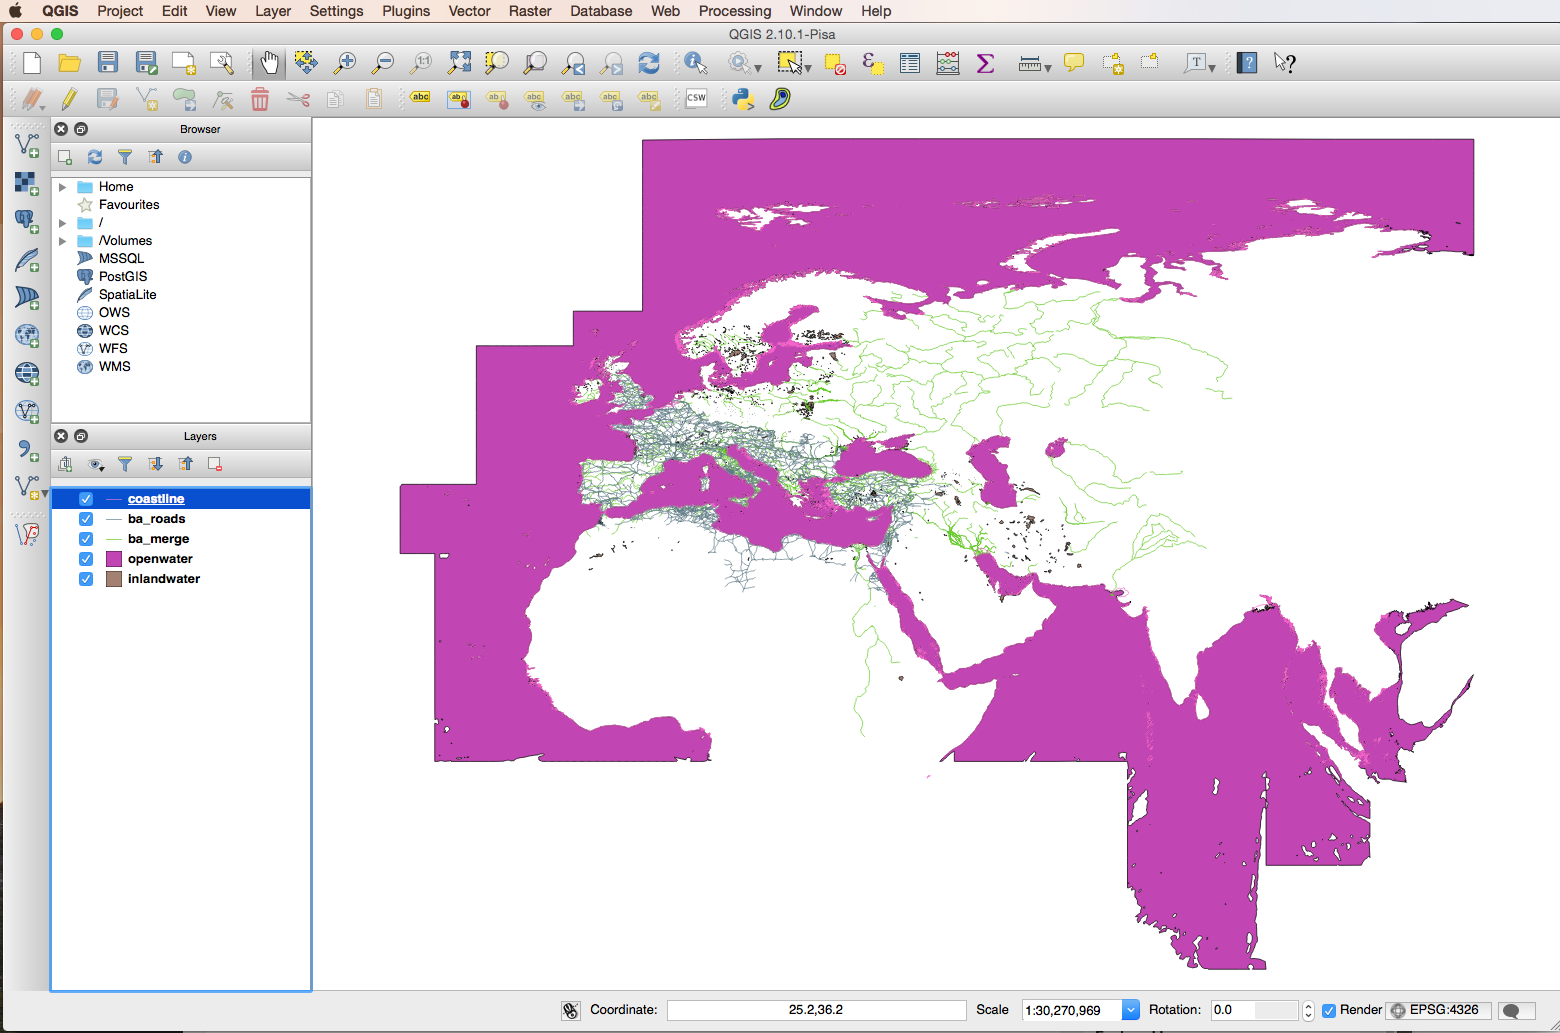
Once you do this, you should have a map that looks like this (the colors might be slightly different):
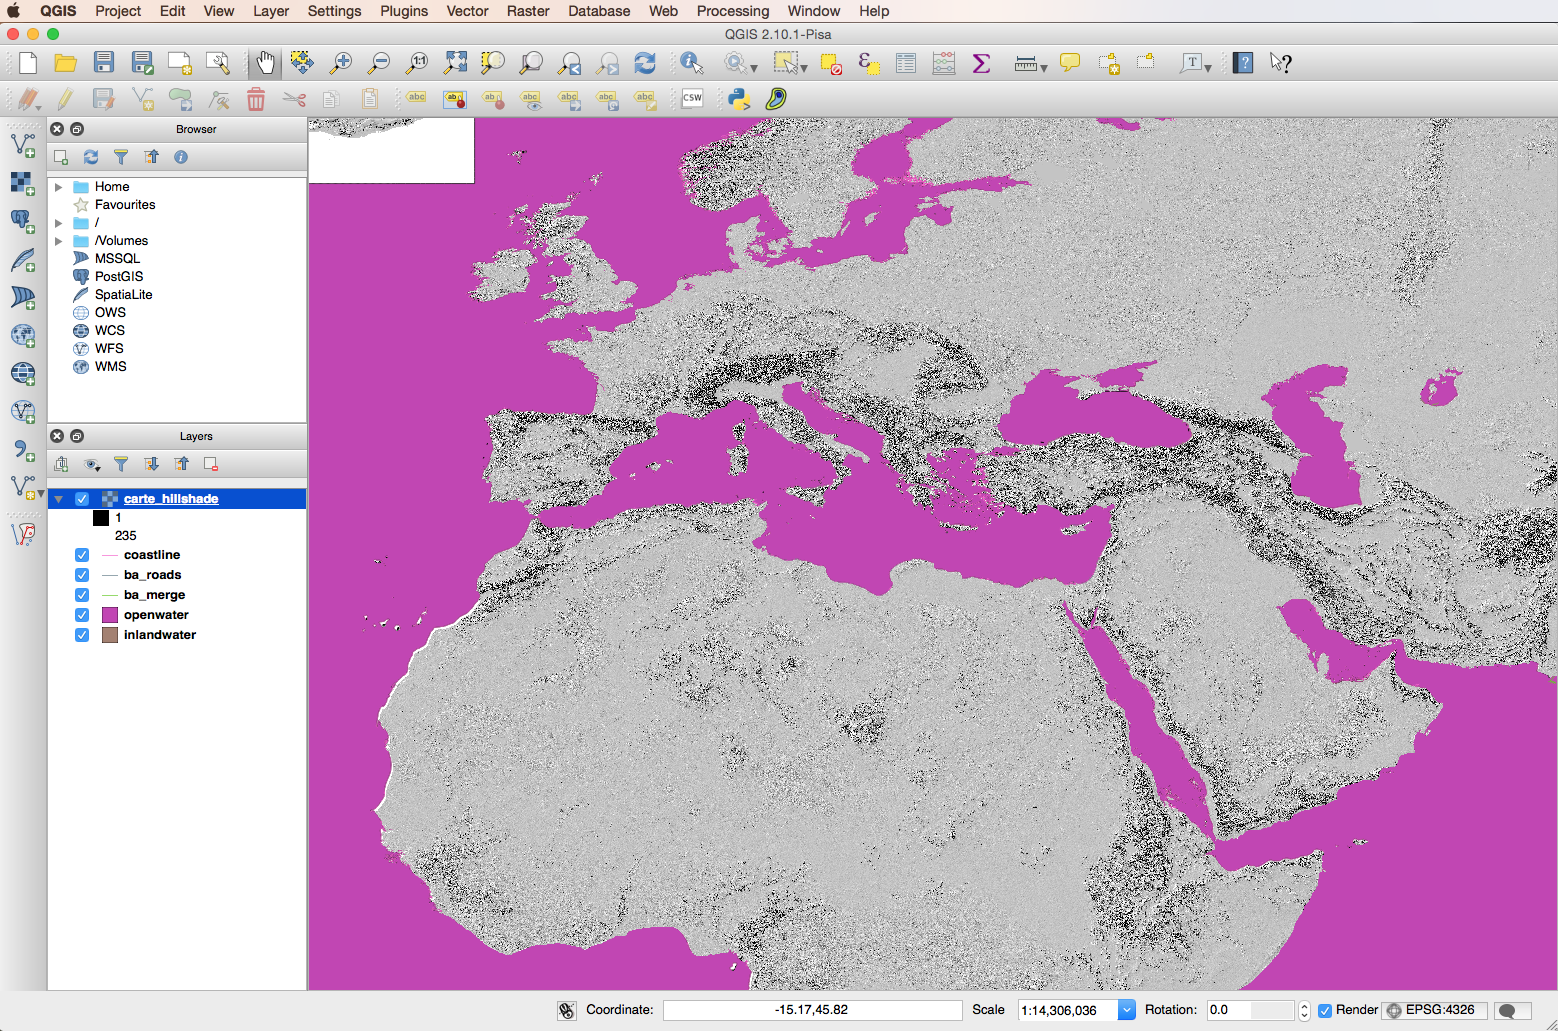
Raster Data Upload: Layer > Add Layer > Add Raster Layer
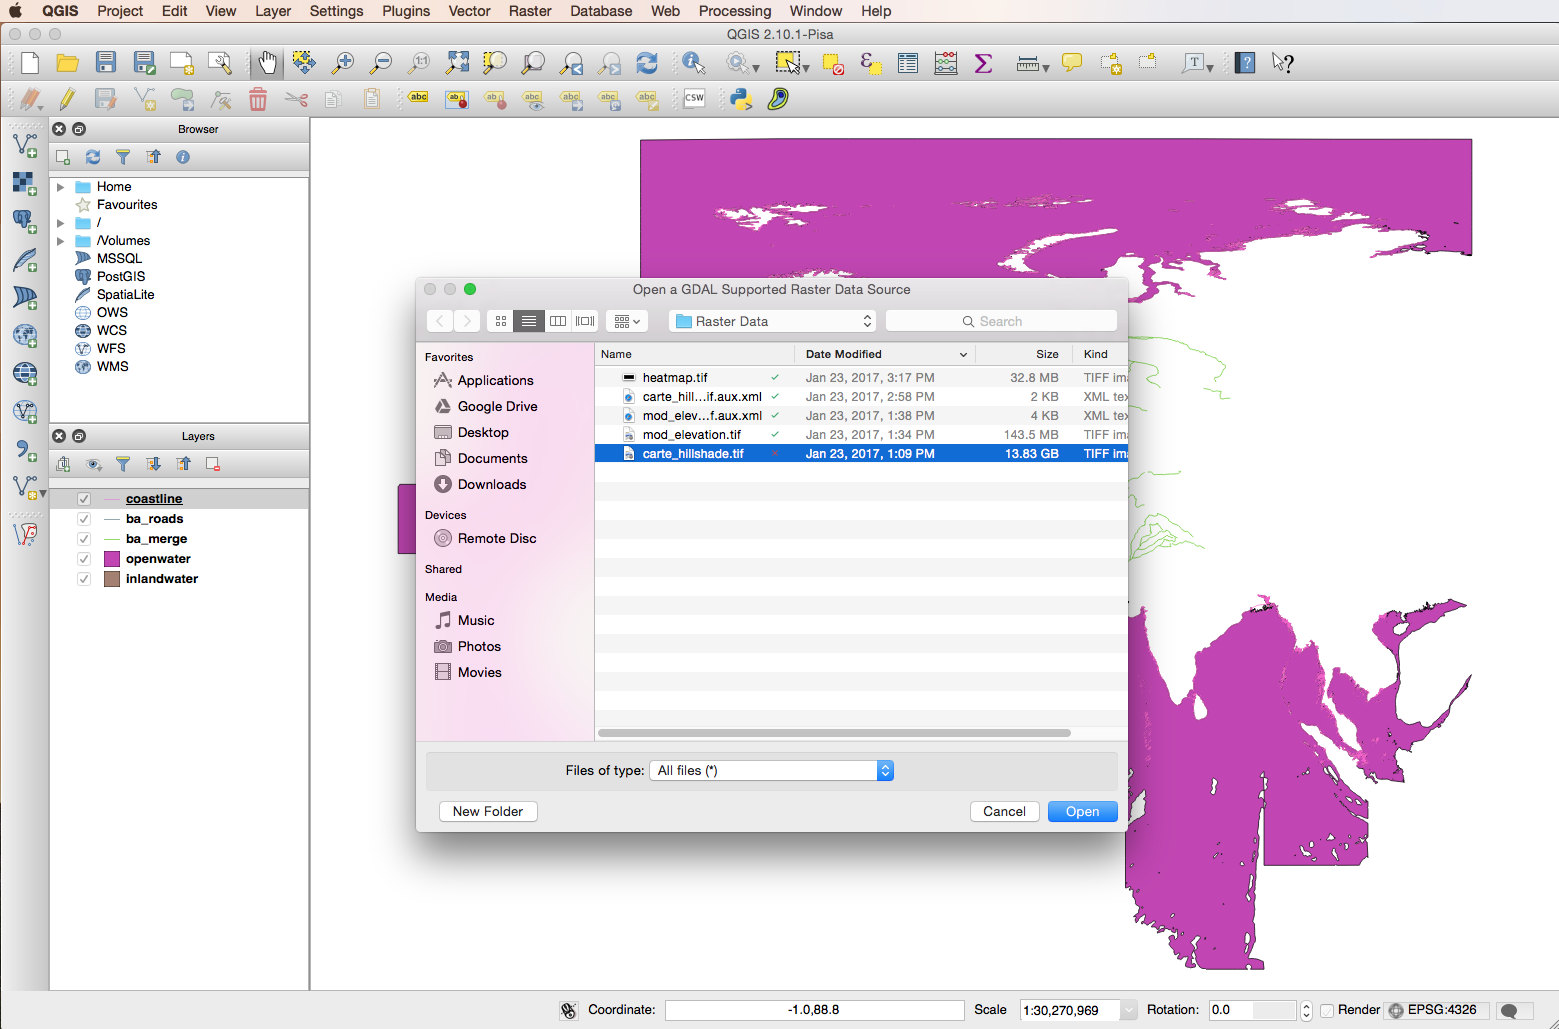
After uploading the elevation raster data, your map will look something like this:
Once all of your vector and raster data is uploaded into QGIS, you will need to make some aesthetic adjustments to suit your individual needs. For example, changing water data to blue and making the elevation layer transparent to make roads and rivers visible. To do this, click on each individual layer to open a dialogue box containing options for style and transparency. Once this is done, your map will look something like this (I have zoomed in a bit so that the elevation data is more clearly visible):

From here, additional layers can be added, including ones that contain geo-referenced data (like specific locations) in the form of a .csv file.
For more reading on ancient mapping, see the following:
Bond, Sarah E. “Roma Aeterna: Open-Access Resources for Mapping the City of Rome.”
Bond, Sarah E. “Resources for Teaching Ancient Geography.”
Gandhi, Ujaval. QGIS Tutorials and Tips
Hello. I can’t seem to be able to download anything from the AWMC site except for xslx files. Do I have to do something else other than clicking in the files I want to download from http://awmc.unc.edu/awmc/map_data/ ?