By Emily Logan
Dale Dougherty, the founder of Make Magazine (2005), (Also: the concept of a Makerspace and the largest Do It Yourself (DIY) Festival in the world called Maker Faire), has been the catalyst for a huge movement inspiring many Americans to tinker with electronics and traditional building tools. This has created a producer rather than consumer subculture that is more interested in building things themselves, than buying the latest name brand product. These people are hobbiests and entrepreneurs; programmers and designers. Here at the Digital Scholarship Center, there is a large focus on software, data visualization, mapping, virtual reality and textual analysis, but there are also several physical computing tools that put this center into the makerspace category. These tools include: arduinos, raspberry pis, 3D scanners and 3D printers.
In my last posts (1 and 2), I proposed a question (If A Garden Could Talk, What Would It Say?) and set out to learn how to program arduino micro-controllers to speak the language of the garden through data visualization. The growerbot I had ordered online is not going to ship until January 2016, so it is time to start from scratch and design my own instead. I have done several tests with the arduino before setting out to build my own smart garden device. The chart below is the result of a test on the arduino using a temperature sensor to measure the degrees in Fahrenheit in the room for 1 minute. I created variation in the reading by putting my hand near the sensor. It picked up my body heat and the temperature rose.
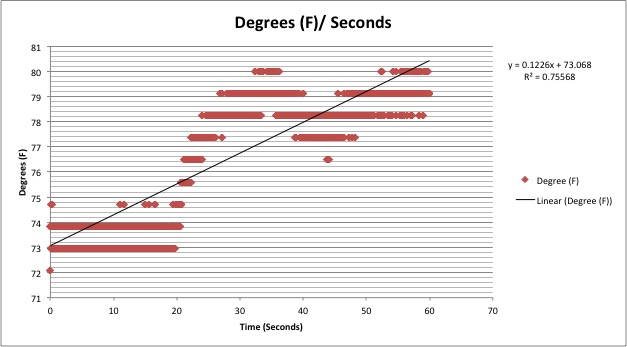
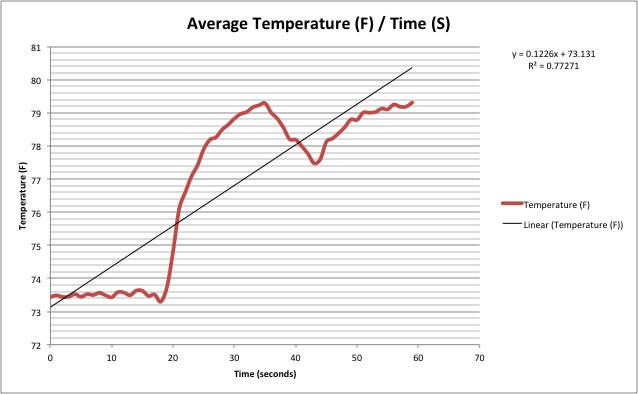
The second graph shows the average temperature per second. Since the arduino captures the data in milliseconds, it is cleaner to see the data in averages. One can see that the shape is a positive linear regression and generally mimics the shape in the first graph, the sample size is just smaller.
The charts were created by turning the arduino data from the serial monitor into a text file using a program called CoolTerm. Once the data is a text file in .csv (comma separated values) format, it can be imported into Excel and visualized. I also experimented with importing the data into a software called JMP, which is a professional statistical program with a free trial download. This program can hold huge data sets mainly for “Big Data” business analytics.
Note: I am slowly collecting source code libraries for the arduino smart garden using Github.
Also, I just bought a domain name for a website (www.defendyourfuturegarden.com) and I am now debating what website platform to use to display the data. Wordpress, or Squarespace? I have an intern from the MIS department at Temple who is going to help build the website. I am thinking that the device might be called The Earth Doctor. Maybe this could evolve into a garden consulting business someday…
I need a tool to monitor egg hatching room temperature using Arduino and my computer is using Linux. Can this be used with Linux and OpenOffice?
HI Julius, I have never used a Linux computer, however if you have access to the internet, you can use Google Sheets to make some nice charts with the data. Hope this helps.