
Happy New Year! What a year we had in 2023. Tumultuous. I predict that 2024 will be equally filled with change and uncertainty. Before we move on to those new challenges, a brief update on an important assessment effort conducted last year, the Strategic Resources Review.
The Review was undertaken to get a clearer sense of how staff, in the aggregate, are spending time towards providing library services.
- How many staff are engaged in work related to collection management?
- Preparing for instruction?
- What percentage of our time is spent with administrative work?
- Are there ways in which we should be shifting our efforts towards a different future of work? For instance, do we need more time to spend on licensing electronic resources? More time developing workshops for students and faculty on the use of artificial intelligence tools?
Our aim was to systematically document how time was being spent on what types of activities This descriptive picture has potential to benchmark current work effort as we identify emerging areas of service to guide future investment.
The approach
Understanding how staff spend time is complicated. We might have asked everyone to document each hour of each day’s work for a year! Instead, we asked each department and unit head to provide a list of all activities and services provided by their unit and the percentage of time (over a year) that staff, in the aggregate, spend on this work. For each department, the total work effort should add up to 100%.
All this was compiled into a large, shared spreadsheet (293 rows), with percentages multiplied by the number of staff in each – amounting to a rough calculation of how much effort we expend, as an organization on services. To strengthen the analysis, we asked about service audience (internal, external) and whether work in that area was increasing or decreasing. We asked how trends were documented (for instance, tracking transactions).
We designated this descriptive phase of the review our Services and Work Effort Catalog. Admittedly subjective and broad, this kind of analysis allowa us to see at a high level, how we use our time.
Early findings
Findings from the effort inventory were not too surprising but describe in a new way how we are currently investing in categories of service at the libraries.
For instance,
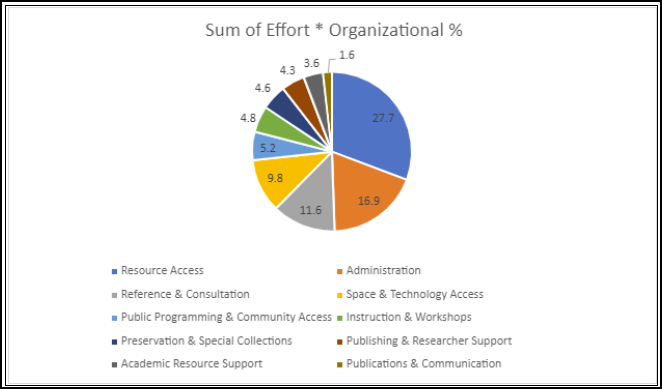
- 1/3 of our activity is devoted to “Resource Access” – this includes circulation, cataloging, acquisition of new materials and stacks management.
- Almost 1/5 relates to Administration – this might be HR functions, committee and professional service activity, or time spent with internal communications.
- We learned that for many services, we’re just not tracking our time investment in a consistent, systematic way. This makes sense. It’s easy to count our instruction sessions, less straightforward to calculate time spent preparing that instruction.
While this descriptive exercise was interesting, there are bigger, unanswered questions. Does this allocation of effort reflect our values as an organization? Is the effort aligned with the impact we desire to have on our communities in support of the work of students, faculty and the community? And how do we measure that value and impact? Perhaps our biggest takeaway is the difficulty quantifying our work in this way, that “return on investment” and true productivity and value are more than numbers that can be calculated with a formula.
–