In the assessment world, we generally like to see numbers that trend upwards. Increases in gate count, use of study rooms, the number of programs and participants – all positive. But the reality is that numbers don’t always rise, and that trend may be harder to understand. Physical circulation in academic libraries is a good example of typical decline – replaced by rising use of e-books. Numbers for reference questions may be decreasing, but we’re spending more time with research consultations.
A recent post at the Scholarly Kitchen blog by David Crotty was frank about the declining number of page views on that important site. He refers to a “significant drop in readership” – in spite of an impressive 232 posts over the year. While daily posts remain as popular, the significant content that makes up the archive is getting less use. He theorizes, “Some of this may stem from changes in search engine algorithms, and some from our older material becoming increasingly obsolete.”
Assessment on the Ground is not nearly as widely read as the Scholarly Kitchen, but Crotty’s transparency and thoughts about numbers prompted me to explore our statistics more deeply.
We published just 10 posts over 2022 but are seeing an increase in author voices – thanks to Jackie Sipes, Caitlin Shanley and Nicole DeSarno. We also profiled work from across the libraries, including that of Becca Fulup, Emily Schiller and the OSAD Process Improvement Team, Stefan DelCotto, and Alicia Pucci’s work with TUScholarShare. This last was the most popular read in 2022, with 116 visits.
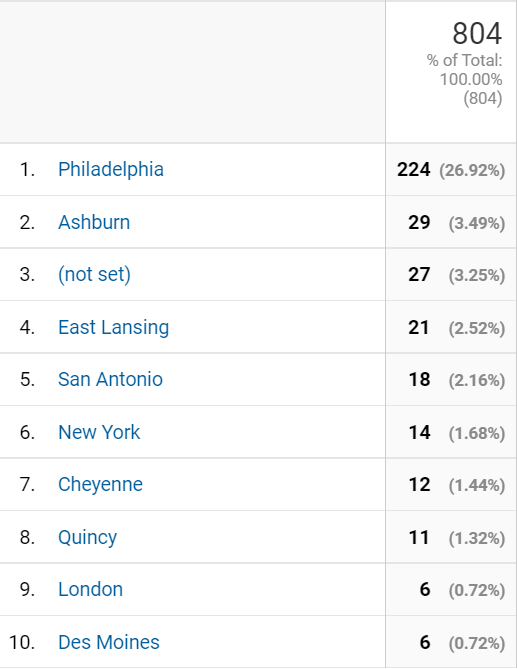
Google Analytics provides us with some interesting information about “reach”. Our core audience is here at Temple, and the Philadelphia area, but we had viewers last year from Texas, Wyoming and London, a total of 804 unique visitors.
Has readership of Assessment on the Ground dropped due to stale content? We have steadily turned out posts since 2014 – and I’d like to think most of those have not aged too badly. Certainly not “obsolete” as Crotty so bluntly describes older posts at Scholarly Kitchen. The first substantial story was an interview with Katy Rawdon on processing special collections. Still relevant and important.
Newer posts do get the most attention, with a bump each time a new post is published.
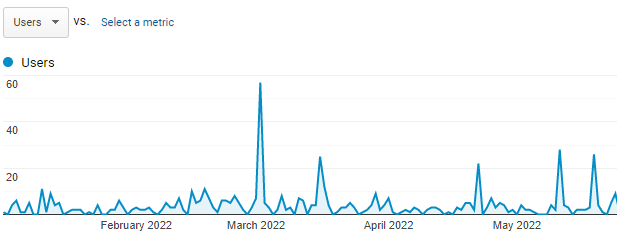
Out of 1188 sessions in 2022, over 87% viewed just the one page, but others explored a little more deeply and viewed 2 pages or more.
Big or little numbers don’t immediately translate to impact, although trends need to be paid attention to understand the meaning behind those trends. And a willingness to be humble. Why the declining numbers?
- Is there more “competition” for good information on library assessment?
- Have viewers learned that the quality of these posts is not worth their time?
Over the years, our readership has remained pretty steady. Comparing this year with last, the number of visitors has gone down by 12%, but the number of pageviews has increased by 14%. And we continue to abide by our core purpose, “Profiling assessment activities at Temple University Libraries and beyond” – to celebrate the work of our staff in the work of assessment and continuous improvement. So there, Chicken Little.