By Huilin Zhu
Introduction
My project aims to study the relationship between built environments and health outcomes, specifically overweight in Pennsylvania. The main innovation of my research is to extract features of satellite maps to measure the built environment. This research has three stages: data collection, data processing, and data analysis.
In the data collection stage, I downloaded all the tile satellite images for Philadelphia by using Python and Google static map API. My previous blog “Measuring the Impact of Built Environments on Health: Gathering Data from Satellite Imagery and Census Maps” talks a lot about this stage.
In this blog, I will focus on the data processing stage, which means extracting environmental features from satellite images obtained in the first stage. From each tile image, we human beings can easily recognize these geographical formations, such as parks, highways, green streets, crosswalks, diverse housing. However, there are around 60000 tile images in Philadelphia, it’s difficult for us to check every image. The better way is to let the computer to recognize these objects in the image so that we can do a big data analysis.
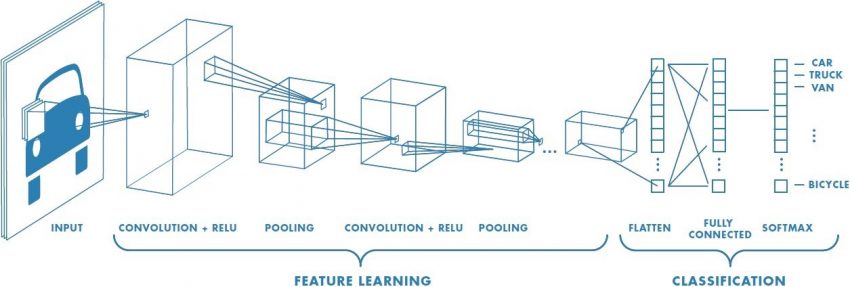
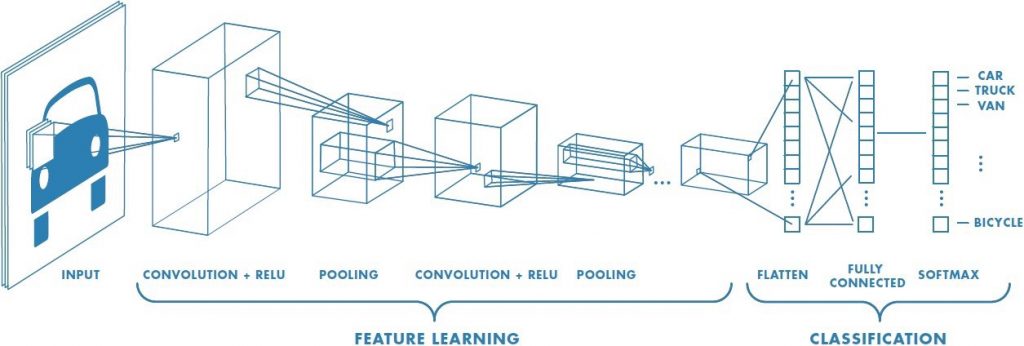
How can the computer recognize the object in one image? One main method is Convolutional Neural Network (CNN).
Convolutional Neural Network
A Convolutional Neural Network (CNN) is a deep learning algorithm that can take in an input image, assign weights to pixels in the image and be able to differentiate different objects in the image. Compared to other image classification algorithms, the main advantage of CNN is its independence from prior knowledge and human effort in feature design. Here are more details about CNN.
In my view, CNN can be regarded as a magic box with the ability of self-learning. For example, if you want to let CNN recognize a car, you can provide at least one thousand images of the car as input and label them as a car. CNN will learn the feature of a car from all these input images through very complex algorithms, and then recognize the car based on these features. Next time, when you give it a new image, CNN can label the object with the possibility of being a car in the image.
Transfer Learning
As a student majoring in Economics, it’s difficult for me to train a new CNN model to classify all the variables in the built environment that matter to the health outcome. So, I plan to implement a transfer learning solution, using pre-trained networks to solve deep learning problems. There are various pre-trained image classification networks available.
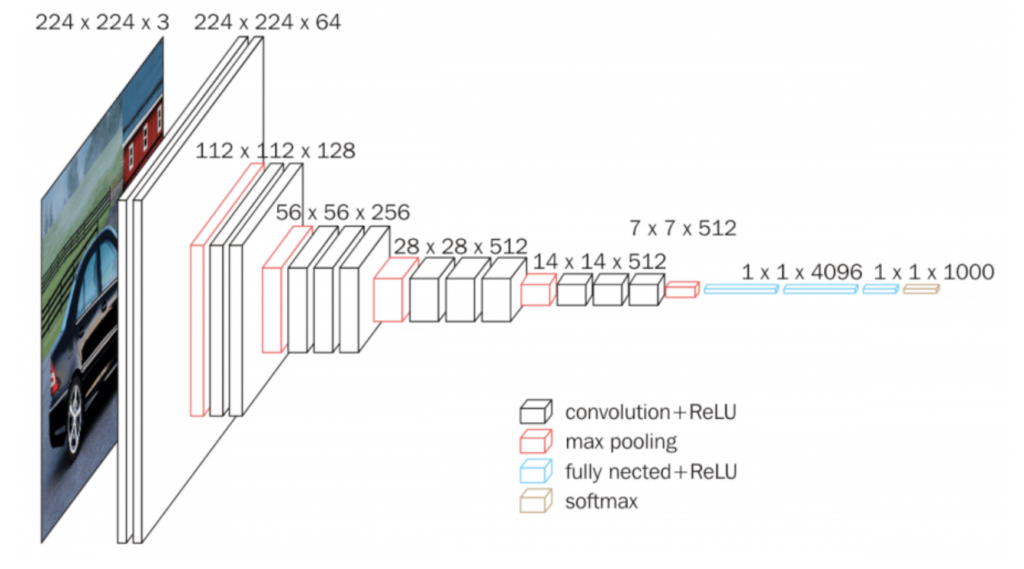
My project plans to use the VGG-CNN-F network. VGG16 is trained over ImageNet, a dataset of over 15 million labeled high-resolution images. It is trained to classifier 1000 different categories of objects. The VGG model can be accessed here. Since the VGG model is available in Keras, I will download the TensorFlow and Keras to implement VGG.
The picture below shows the architecture of VGG16.
One main concern of transferring learning is the image data difference. The image I want to analysis is the satellite image, including parks, highways, green streets, crosswalks, diverse housing. The input data set ImageNet of VGG includes images of animals, geological formation, natural objects, and many other different categories.
Since my data is different from the input data, one solution is to build the classifier based on your own dataset and adjust the network. It requires more training in machine learning. So, I plan to try another way, using the second fully connected layer of the VGG-CNN-F network to overcome this problem. The main reason why I use VGG16 is that this neural network can transform a two-dimensional image into a single vector of fixed dimension, which contains only the most important descriptors of the image.
This project plans to employ this technique to transform satellite images into a feature vector of length 4096, taken from a second fully connected layer of the VGG-CNN-F network. These 4096 variables do not have a specific meaning, but they can represent the indicator of the built environment, including color, gradient, edge, height, length, etc. After I obtain these built environment variables, I will combine them with the health outcome of obesity prevalence to study the association between the built environment and overweight.
Future work
Currently, I am still in the stage of data processing. I need more time to use CNN to extract the feature of the built environment for each tile image, and then connect them with census tract data. After obtaining features in the built environment in the data processing stage, I will move to the data analysis stage to study the association between the built environment and health.
In the data analysis stage, the elastic net algorithm will be employed to run a regression. Health outcome is regarded as the dependent variable. The independent variables would be the variables drawn from CNN, such as color, gradient, edge, height, length, etc. Using the regression, I can capture the features of the built environment related to the possibility of being obese, and predict obesity prevalence for each census tract area based on a static map.