By Huilin Zhu
Introduction
My project aims to study the relationship between built environments and health outcomes, specifically excess weight in Pennsylvania. My primary research question is: Does where you live can affect your health? What is a good community design for health?
I am curious about the role built environments play in our health. For my digital fellowship project, I plan to use satellite imagery and transfer learning to extract data representing the feature of the built environment from Google maps, and to investigate the links between the built environment and health outcomes.
Built environment
A “built environment” can be defined as a human-made space in which people live, work, and recreate on a day-to-day basis, including buildings, parks, roads, lakes, etc. Factors of the “built environment” can determine individuals’ access to food, health resources, and facilities that promote physical activity and healthy behaviors.
Based on the previous study, there are two main channels by which the built environment can affect body weight index (BMI): physical activity environment and food environment. Some features, such as land-use diversity and street connectivity, may increase physical activity, thus lowering the possibilities of being obese (Frank et al.,2007;Brown et al.,2009, Doyle et al., 2006). Limited access to healthy food increases the probability of obesity(Rundle et al.,2009;Inagami et al.,2009).
Satellite imagery
For the data collection stage of my project, I use Google static maps as the main resource to capture features for the built environment. Google static maps can capture the physical characteristics of a neighborhood such as the presence of parks, highways, green streets, crosswalks, diverse housing. But we cannot recognize the specific use of the building since the google static map cannot provide detailed information about a specific place.
Initially, I want to use a high-resolution map for one city and raster it to tile images. The problem is that pixels for the initial map are not large enough. My project requires the size of each tile 256*256 pixels. That means each census tract needs to be mapped into tens or hundreds of tiles. For example, Philadelphia has 384 census tracts. About 60000 tile images need to be downloaded for Philadelphia. However, I cannot find a publicly available super high-resolution map that can support the 256*256 pixel after being divided into 60000 pieces.
So I choose to get tile geographic information first and then download images accordingly form google static map. Google static maps offer free plans, with daily download limits of 25,000 requests per day. The difficulty here is how to access each tile image from the Google Static Map API. This is very tough for me. I am very glad that Tim Bieniosek in the digital scholar center help me figure it out. We use the shapefile, divide the shapefile into census tract, and then divide each census tract into a square grid. With the geographic information in each grid, we can download the google map directly by using Python. Python loop code can allow us to keep on downloading tile images, and we do not need to manually download image one by one.
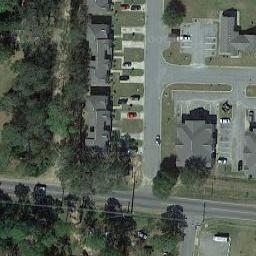
The below is one tile image downloaded from google static map. The size of each tile is 256*256 pixels, covering an area of 77m*77m in the real world(zoom level 20).

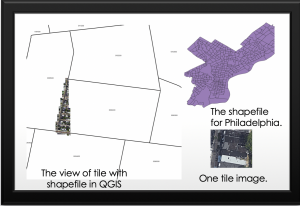
After we download some tile image, we put these images into QGIS to make sure the images are downloaded correctly. The below picture shows how the tile images look like in the shapefile for Philadelphia. In the left picture, there are about 100 tile images in the first layer, the second layer is the shapefile for Philadelphia. Each number in the second layer is a specific number indicating the census tract, city, state.

Future work
Currently, I am still in the stage of data collecting. Even for one city Philadelphia, about 60,000 tile image needs to be downloaded. It takes some time. After I get all tile images ready, I will do the following work:
- Use a convolutional neural network (CNN) to extract data representing the feature of built environment. A Convolutional Neural Network (CNN) is a deep learning algorithm that can take in an input image, assign weights to pixels in the image and be able to differentiate different objects in the image. This project will collect outputs from the penultimate layer of the network for each image in the data set.
- Use the elastic net algorithm to run a regression to find the correlation between the built environment and body weight. Health outcome is regarded as the dependent variable. The independent variables would be the variables drawn from CNN, such as color, gradient, edge, height, length, etc..
- Do data analysis including control variables: median household income, percentage of male(female), percentage of the race (White, Black, Asian, and other race), percentage of households under the poverty line.
- Get the data of places of interest to investigate how the built environment will affect body weight through a food access channel.
