Skip to content

Loretta C. Duckworth Scholars Studio

⠀

Menu
  • Scholars Studio Blog
    • Digital Methods
      • coding
      • critical making
      • data visualization
      • digital pedagogy
      • immersive technology (AR/VR)
      • mapping
      • textual analysis
      • web scraping
    • Disciplinary Fields
      • Anthropology
      • Archaeology
      • Architecture
      • Art History
      • Business
      • Computer Science
      • Critical Digital Studies
      • Cultural Studies
      • Dance
      • Economics
      • Education
      • Environmental Studies
      • Film Studies
      • Gaming Studies
      • Geography
      • History
      • Information Science
      • Linguistics
      • Literary Studies
      • Marketing
      • Media and Communication Studies
      • Music Studies
      • Political Science
      • Psychology
      • Public Health
      • Sculpture
      • Sociology
      • Urban Studies
      • Visual Art
    • Cultural Analytics Practicum Blogposts
  • Current Staff
  • Newsletter
  • About
    • Games Group 
Menu

Working Around Some Limitations in OpenRefine

Posted on March 6, 2018April 27, 2018 by Luling Huang

By Luling Huang

I’ve been using OpenRefine (OR; OpenRefine Development Team, 2013) for data cleaning for a while. The experience has been great. OR’s own General Refine Expression Language (GREL) is simple compared with Excel’s formulas, yet powerful. The user interface makes it convenient to “click-and-manipulate” your data, compared with Python’s pandas. However, not every tool suits every user’s need. Based on my experience, I’ve found three limitations. I talked about the first limitation (the difficulty in splitting data by rows and exporting subsets) and a partial solution in an earlier blog post. The current post introduces two OR extensions to work around the other two issues.

I. Adding New Rows

If you’ve worked with spreadsheet programs, adding new rows would not seem to be a problem. Oddly enough, there is no way to add rows in OR. Why? The simple answer is OR is not a spreadsheet program (see the comparisons here and here; also, see the response to this issue by one of the developers here). In short, OR does its best in mass editing/transformation across rows, rather than in individual cell editing. Having said that, no matter how strictly the OR developers had envisioned what OR should and should not do, could there possibly be a single time when you just want to add a new row? I encountered this situation multiple times. And here comes the help from an OR extension called the GOKb Utilities (Ibbotson, Osguthorpe, & Stephens, 2017).

It is simple to install an OR extension. After OR is opened, on the “Open Project” page, at the bottom click “Browse workspace directory.” This will open the directory where extension should be installed. If this is your first time installing an extension, create a folder called “extensions.”

Most OR extensions host a github page. A list of OR extensions can be found here. On an extension’s github page, click “Download Zip.” Extract the downloaded folder into the “extensions” folder you just created. Restart OR, the installed extension should work.

After the GOKb Utilities extension is installed, in the dropdown menu of the “All” column on the most-left, go to “Edit rows”, and you’ll see “Prepend Rows.”

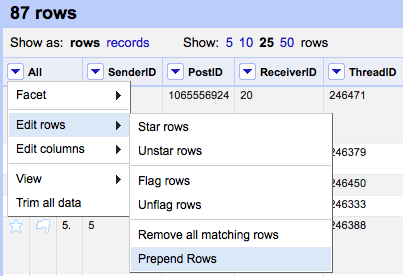
You can choose how many rows you want to insert. Here I inserted 5, and it looks like this:

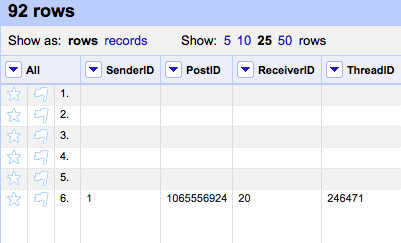
Amazing. This extension is simple to use, compared with an obscure workaround by using column transpose. You may also wonder how to insert rows above or below certain rows. Well, the question is whether row order matters. If it does, it is more likely than not that there is a column on which the order is based. You can just input the order information for the new rows and sort that column later.

II. Calculating Descriptive Statistics

At times, I have a column that stores continuous data and just want to know some descriptive statistics of that variable, such as mean, median, standard deviation, etc. In such a case, OR developers would suggest I export the data and let the data analysis tools handle this. But OR is open source and others have developed an extension called refine-stats (Germuska & Groskopf, 2013).

After the refine-stats extension is installed, in the dropdown menu of any column (except for “All”), you’ll see “Column statistics.” Note that the extension does not return a frequency table for nominal data (the built-in text facet can accomplish this). Remember to make sure that the data type of the column to be calculated is number, not text.

Leave a Reply

You must be logged in to post a comment.

Recent Posts

  • The Untold History of Fletcher Street’s Stables April 21, 2025
  • Building an Immersive Archive of the Greek Orthodox Churches in Istanbul April 15, 2025
  • Tracing Influence in Genealogies of Communication Theory April 14, 2025

Tags

3D modeling 3D printing arduino augmented reality banned books coding corpus building critical making Cultural Heritage data cleaning data visualization Digital Preservation digital reconstruction digital scholarship film editing game design games gephi human subject research linked open data machine learning makerspace makerspace residency mapping network analysis oculus rift omeka OpenRefine Photogrammetry Python QGIS R SketchUp stylometry text analysis text mining textual analysis top news twitter video analysis virtual reality visual analysis voyant web scraping webscraping

Recent Posts

  • The Untold History of Fletcher Street’s Stables April 21, 2025
  • Building an Immersive Archive of the Greek Orthodox Churches in Istanbul April 15, 2025
  • Tracing Influence in Genealogies of Communication Theory April 14, 2025

Archives

Meta

  • Log in
  • Entries feed
  • Comments feed
  • WordPress.org

Archives

Blog Tags

3D modeling (11) 3D printing (14) arduino (8) augmented reality (5) banned books (3) coding (12) corpus building (4) critical making (7) Cultural Heritage (11) data cleaning (4) data visualization (11) Digital Preservation (3) digital reconstruction (9) digital scholarship (12) film editing (3) game design (3) games (6) gephi (3) human subject research (3) linked open data (4) machine learning (6) makerspace (8) makerspace residency (4) mapping (30) network analysis (17) oculus rift (8) omeka (3) OpenRefine (4) Photogrammetry (5) Python (8) QGIS (10) R (9) SketchUp (4) stylometry (8) text analysis (10) text mining (4) textual analysis (32) top news (102) twitter (5) video analysis (4) virtual reality (17) visual analysis (5) voyant (4) web scraping (16) webscraping (3)

Recent Posts

  • The Untold History of Fletcher Street’s Stables April 21, 2025
  • Building an Immersive Archive of the Greek Orthodox Churches in Istanbul April 15, 2025
  • Tracing Influence in Genealogies of Communication Theory April 14, 2025
  • From Theory to Practice: Weaving in Response to the Grid in the Global Context March 26, 2025
  • Visiting a Land of Twilight February 24, 2025

Archives

©2025 Loretta C. Duckworth Scholars Studio | Design: Newspaperly WordPress Theme
Menu
  • Scholars Studio Blog
    • Digital Methods
      • coding
      • critical making
      • data visualization
      • digital pedagogy
      • immersive technology (AR/VR)
      • mapping
      • textual analysis
      • web scraping
    • Disciplinary Fields
      • Anthropology
      • Archaeology
      • Architecture
      • Art History
      • Business
      • Computer Science
      • Critical Digital Studies
      • Cultural Studies
      • Dance
      • Economics
      • Education
      • Environmental Studies
      • Film Studies
      • Gaming Studies
      • Geography
      • History
      • Information Science
      • Linguistics
      • Literary Studies
      • Marketing
      • Media and Communication Studies
      • Music Studies
      • Political Science
      • Psychology
      • Public Health
      • Sculpture
      • Sociology
      • Urban Studies
      • Visual Art
    • Cultural Analytics Practicum Blogposts
  • Current Staff
  • Newsletter
  • About
    • Games Group