By Crystal Tatis
Fun Fact
Netflix’s Original Show House of Cards was not bought by the company just because they thought that subscribers would like it. The $100 million show was chosen based entirely on data. They have a direct relationship with the consumers so they knew that users watched the David Fincher directed movie The Social Network from beginning to end, they also watched the British version of House of Cards and those who watched the British version of House of Cards also watched Kevin Spacey films and/or David Fincher directed films. Meaning that data is the reason you have a happier streaming life.
#MakeOverMonday
Data has this preconceived reputation that it’s just a lot of numbers that no one but geniuses understand and that it just helps project sales and the weather. However, Tableau Software (free software that provides interactive data visualizations focused on business intelligence) has come up with a way to challenge its community to practice data visualization, be creative and get recognized for their work. They created a weekly social project called #MakeoverMonday where each Sunday, Andy Kriebel (Five-time Tableau Zen Master) will share a link to that week’s original article (for context) and data set on his blog, VizWiz.com and then it’s up to you to rework that data and visualize the story you see from the data.
The Rules:
- This is not about criticizing the original authors. They are people like you and me and they have feelings. Focus on the data, the charts and the story.
- Use the hashtag #MakeoverMonday on Twitter if you create your own version and would like to share it.
- Include a picture of the visualization when you post to Twitter and it will be included on the Pinterest board.
- Focus on what works, what doesn’t work, why those things don’t work, and how you made it better.
- The purpose of the makeover is to improve on the original visualization. You should try stick to the fields in the data set provided and improve upon the original visualization. However, if supplementing the data helps you tell a better story, go for it!
- Give credit to the original data source whenever possible.
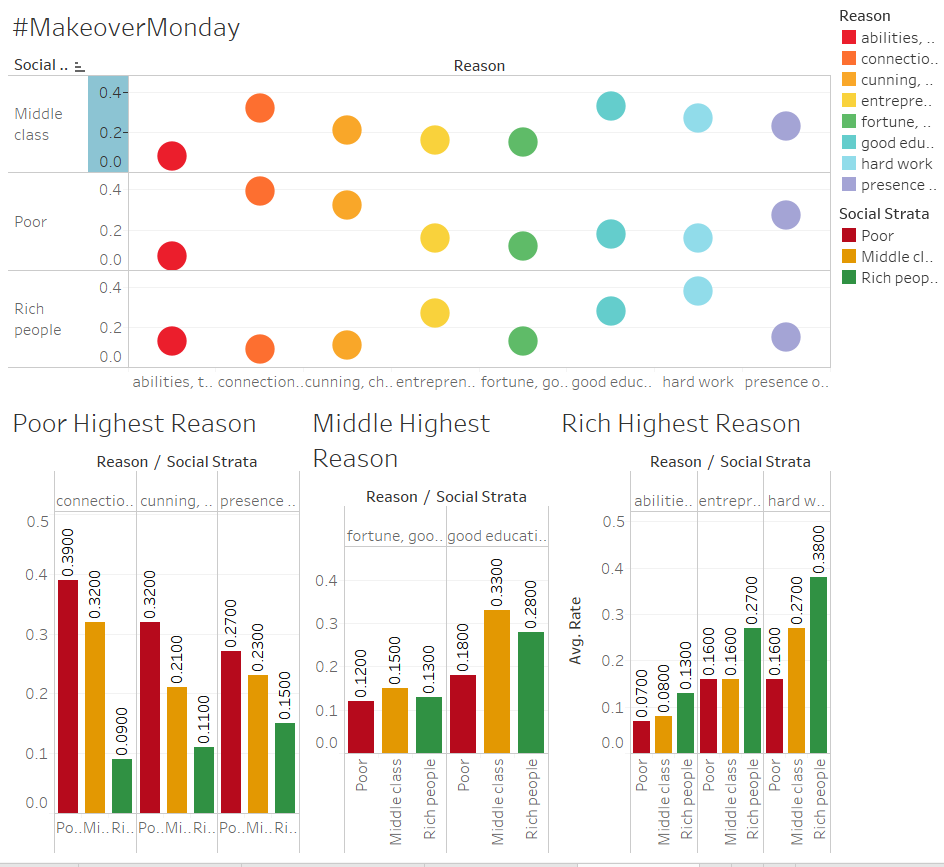
They talk about very relevant topics that a broad audience can identify with, from Cats v.s. Dogs to The Accounts Donald Trump Retweeted During The Election. This week’s challenge is called The Secret of Success, where representatives from different social strata asked: What are the main reasons for success?
You can find the data set here
Just to get you guys inspired I will share mine here.
Just comment below with the URL from your try at this week’s challenge.
Nice work!!!