By Joyce Rasing
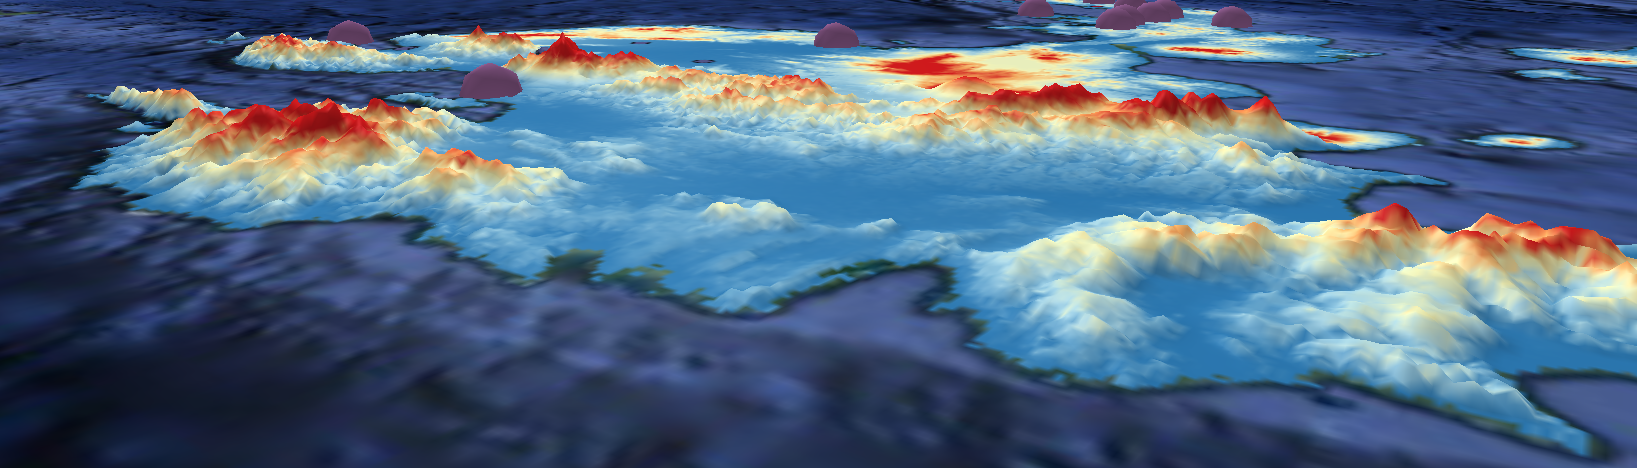
Developments since my previous post include finding a QGIS plugin for 3D terrain modeling called Qgis2threejs. Previously, I exemplified two different types of methods to view terrain: using contour lines or using a hillshade. However, it is not the only way to visualize what I am trying to find.
I want to know if there is a correlation between the terrain and the Abu Sayyaf Group’s mode of attack, and/or if there is a correlation between the terrain and the target type. Instead of creating contour lines or showing a hillshade layer, I chose to stick with the original DEM data that I started with for visualizing the terrain.
However, I searched for a different way to visualize the terrain other than just a 2D display on the screen. I chose a plugin called Qgis2threejs, which produces a 3D map visualization that combines elevation and geocoded points, along with any other layer if needed. I had already geocoded X and Y coordinates from the Global Terrorism Database (GTD) to the specific locations on the Philippine islands.With the GTD, we can read the locations of where the attacks occurred, but we might not know much about the kind of terrain in which these attacks occurred. Visualizing the terrain helps individuals understand how geography influences the group’s choices in their methods, and brings to light locations of interest. The current stage that I am in is to look for a better way to visualize this information.
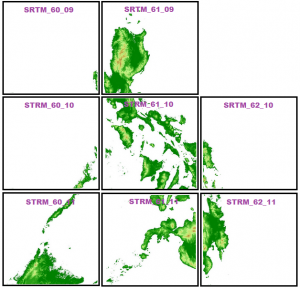
Back to the plugin: I used the original DEM data with a different color band to show elevation. The problem with the SRTM DEM data is that it came in tiles, so after the first run of the Qgis2threejs plugin, I noticed discontinuity in the DEM display. Qgis2threejs outputs a .html file in which you can maneuver the map extent that you see in QGIS and can zoom in, out, and around the area that you want to view.
For viewing purposes and to focus on a specific area, I created a guide to use to keep track of which DEM I am using. As you can see in the video, I am using the srtm_62_11 layer for the DEM, which is otherwise known as the eastern part of the Mindanao region of the Philippines.
In order to create a smooth representation of the DEM data, I merged DEM data, in which I did using ArcGIS. This made using the Qgis2threejs 3D visualization a lot easier, but I am looking for a way to accurately portray the elevation of the DEM. Also, the plugin is limited to the layers and elevation displayed. For example, there are not many options when it comes to labeling the features on the map, and it is not an interactive plugin.
The two islands visualized on the bottom left are within the Autonomous Region in Muslim Mindanao (ARMM) in the Sulu Archipelago and are not mountainous. This region in the Philippines is notoriously known for high occurrences of kidnappings, and at a glance, Abu Sayyaf chooses lower terrain for their attacks. But what does that mean for the rest of the Mindanao region? Is there a reason for the bombing/explosion attacks that happen on the eastern side of map below, and a reason for hostage/taking that occurs on the western part of the island exemplified? These kinds of questions are part of the next step that I wish to investigate.
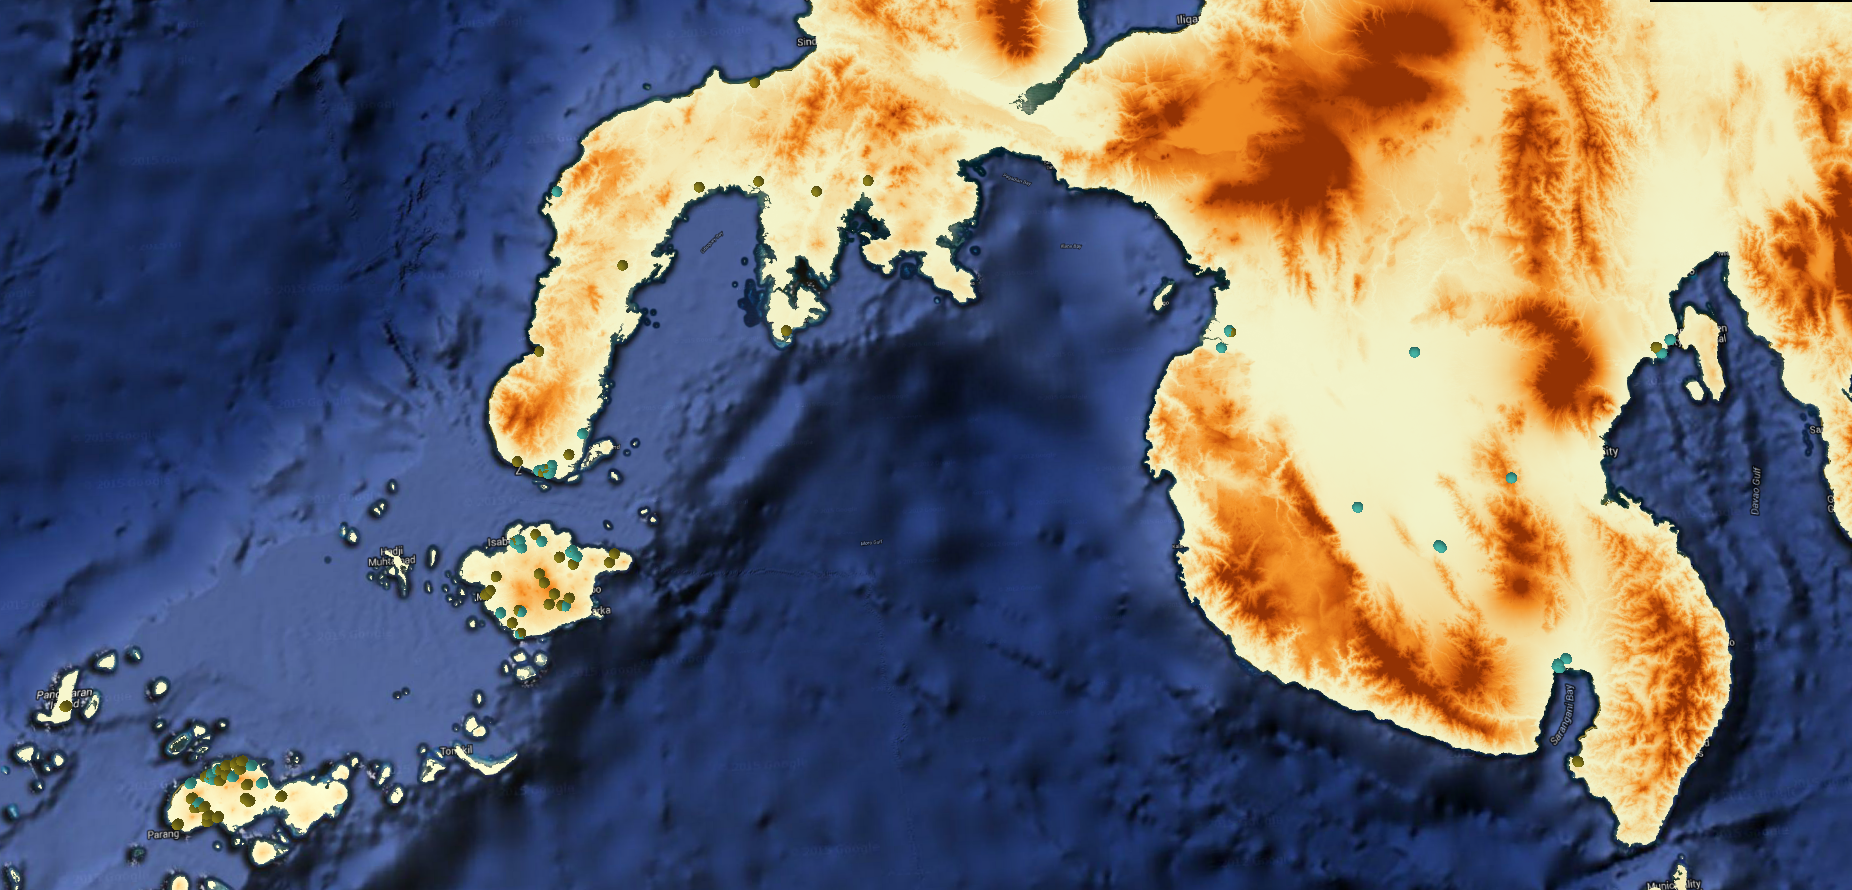
Mindanao is an island an Muslim-dominant area that has long endured separatist armed conflict