By Jaclyn Partyka
In my previous blog posts, I described my first forays into Stylometry and then reviewed Signature as a viable, but ultimately limited stylometric tool. In this post I’ll talk about n-grams and quickly review JGAAP and R-stylo before giving you a bit of a glimpse into my own research.
While Signature provided some basic frequency analytics of data (such as letters, punctuation, word length, sentence length, and paragraph length), many of these measures have fallen out of fashion in current stylometric research. Rather, following John Burrows and his Delta method, the preferred method of analysis is to use statistical frequency measures to look at n-grams.
In linguistics and computational statistics, n-grams are essentially numeric sets of characters or words used to measure probability. So, for example, a word n-gram of size two (sometimes called a bigram) would take a sentence such as this quote from Roth’s The Counterlife: “He sat down at the desk and began to read” and create the following list: “he sat” “sat down” “down at” “at the” “the desk” “desk and” “and began” “began to” “to read”
You can also make character n-grams. Here’s a list of character trigrams (3 characters) using the same sentence as above: “h e ” “e s” ” s a” “s a t” “a t ” “t d” ” d o” “d o w” “o w n” “w n ” “n a” ” a t” “a t ” “t t” ” t h” “t h e” “h e ” “e d” ” d e” “d e s” “e s k” “s k ” “k a” ” a n” “a n d” “n d ” “d b” ” b e” “b e g” “e g a” “g a n” “a n ” “n t” ” t o” “t o ” “o r” ” r e” “r e a” “e a d”
Essentially, you could do this manually, but it’s so much easier for a computer program like JGAAP or R to do the work for you, especially if you have a large corpus.
JGAAP stands for “Java Graphical Authorship Attribution Program” and it was designed by Patrick Juola of Duquesne University. It is a free Java-based program for textual analysis, text categorization, and authorship attribution. It has an easy to use graphical user interface (GUI) which even includes explanations for specific analytical options.
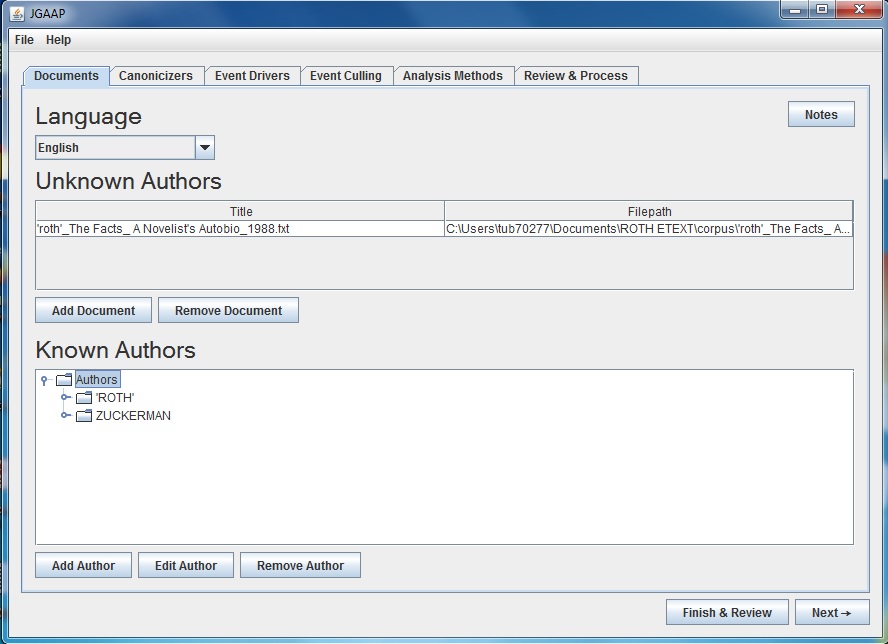
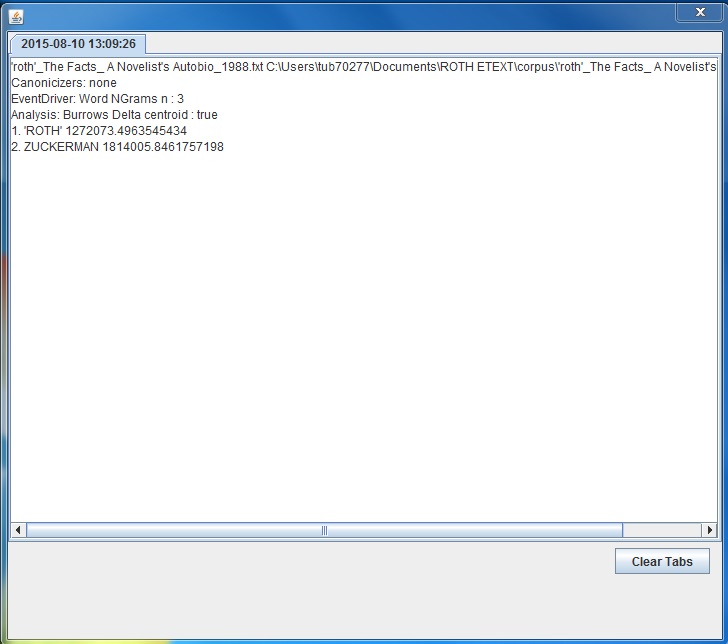
However, while JGAAP can run through a number of customized stylometric analyses simultaneously, the output of data is very limited and it does not have a graphical option. The program will list the most likely candidate first and include the numerical probability data but the details of the analysis is hidden from basic users. So, JGAAP would be useful for a closed set of likely candidates with an unknown text, but the data would have to be extracted for advanced analytics or graphical representation.
In light of the limitations of both Signature and JGAAP, R-stylo seems like the ideal program for stylometric textual analysis. R and RStudio are free to download and the “stylo” package is easily downloadable via R’s CRAN directory. Additionally, there are a number of active scholars who use R-stylo so the support community online is very helpful for beginners.
Some may balk at using R-stylo because it involves more upfront work and some familiarity with coding language. However, R-stylo’s functional GUI interface, its capacity to graphically display results in a variety of different and customizable formats, and its ability to perform machine learning analytics make it the best option for stylometric analysis at this current time.
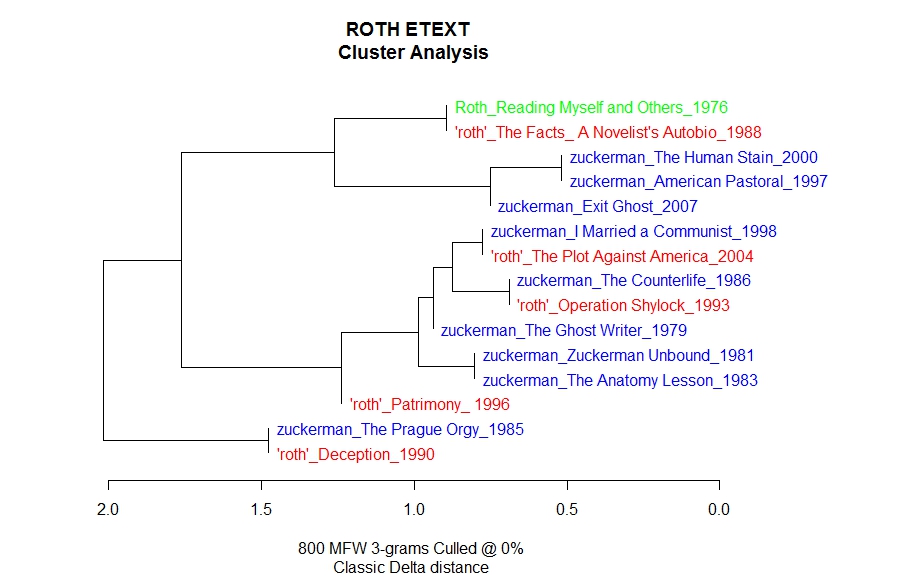
As an example, here is a cluster analysis of Roth’s corpus according to either “Roth” or “Zuckerman” novels. It’s really interesting that the only officially nonfictional entry from the corpus, Reading Myself and Others correlates so closely to The Facts: A Novelist’s Autobiography, even though this novel plays with some metafictional techniques.
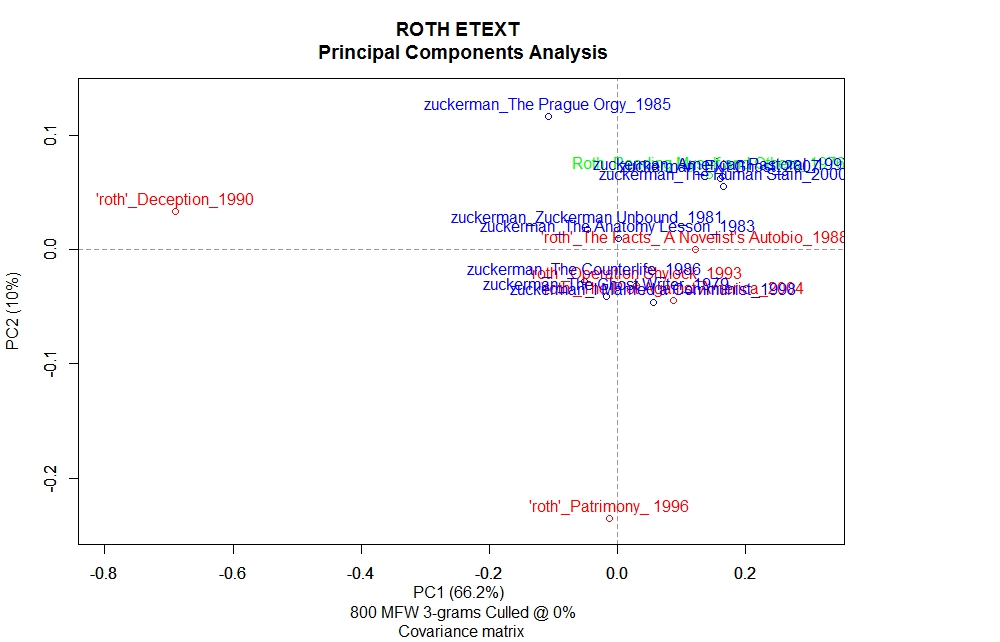
And here is a Principal Component Analysis (PCA) of the same data. What’s different here is the statistical algorithm that R-stylo uses to measure the authorship probability. Though these are both distance measures, the kind of algorithm used really affects how the data is represented. So, it’s important that you really consider the best method of analysis for your specific project. Obviously the Cluster Analysis is much easier to read without much editing, while the PCA analysis would have to be plotted using symbols, which is an additional option in R. However, I also think the messiness on this graph is good, since it shows a significant overlap between the Zuckerman and the ‘Roth’ corpora, supporting the claim that the division between these two sets of texts is certainly permeable.
Finally, R-stylo has a rolling.classify option which takes a test corpus of, in this case, novels, and then reads it to determine multi-authored works. Maciej Eder most recently used this function to look at Harper Lee’s newly published novel Go Set a Watchman in order to determine the degree of Truman Capote’s involvement.
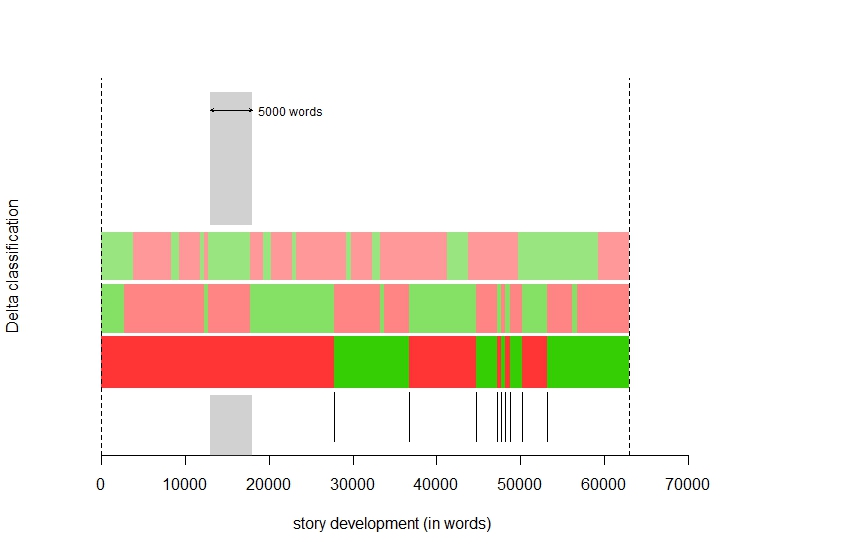
Note: ‘Roth’ is in Red and Zuckerman is in Green.
As for me, this rolling.classify analysis of Roth’s The Facts: The Novelist’s Autobiography reinforces what we already know about the structure of the novel, while also providing some interesting observations. We already know that the structure of the “autobiography” begins with a paratextal letter composed by “Roth” to Zuckerman and then Zuckerman replies to this letter at the end. This graph clearly supports the appearance of Zuckerman’s narration at the end of the novel, but what’s interesting is the middle section of the autobiography that also reads as a “Zuckerman” section. This section is most likely the description of Roth’s relationship with his first wife, “Josie” – a tumultuous event that he fictionalized in earlier novels. Ultimately, what these preliminary stylometric findings reveal is that there is indeed some kind of key stylistic difference between Roth’s and Zuckerman’s brand of authorship, a claim I will develop further over this next semester.