By Danielle A Guimaraes
As a HASTAC scholar at the Center for the Humanities at Temple (CHAT) in 2013-14, I created a project (“Models of Early Modern Charity: The Example of Venice”) to trace the foundation of charitable institutions in Venice through time. At that time, I decided to use WorldMap, a tool developed by Harvard, as the platform for my mapping project. Focusing on the visualization of charity in the city, the model explores the establishment of charitable institutions from the tenth century, when the first organization was documented in Venice, until the eighteenth century, which was marked by the fall of the Venetian Republic to Napoleon Bonaparte in 1797. Initially, three broad objectives were associated with the creation of this HASTAC project. The first was to make the data on the foundation of these charitable organizations available online for the academic community and the general public. The second aim was to portray this information in an interactive and dynamic manner that departed from the traditional approach (static maps, lists, tables, etc.) used in written sources, creating a model that scholars can use to ‘test’ historical questions or hypothesis. Finally, this project strived to show the scholarly benefits of incorporating digital tools into the fields of art and architectural history and urbanism.
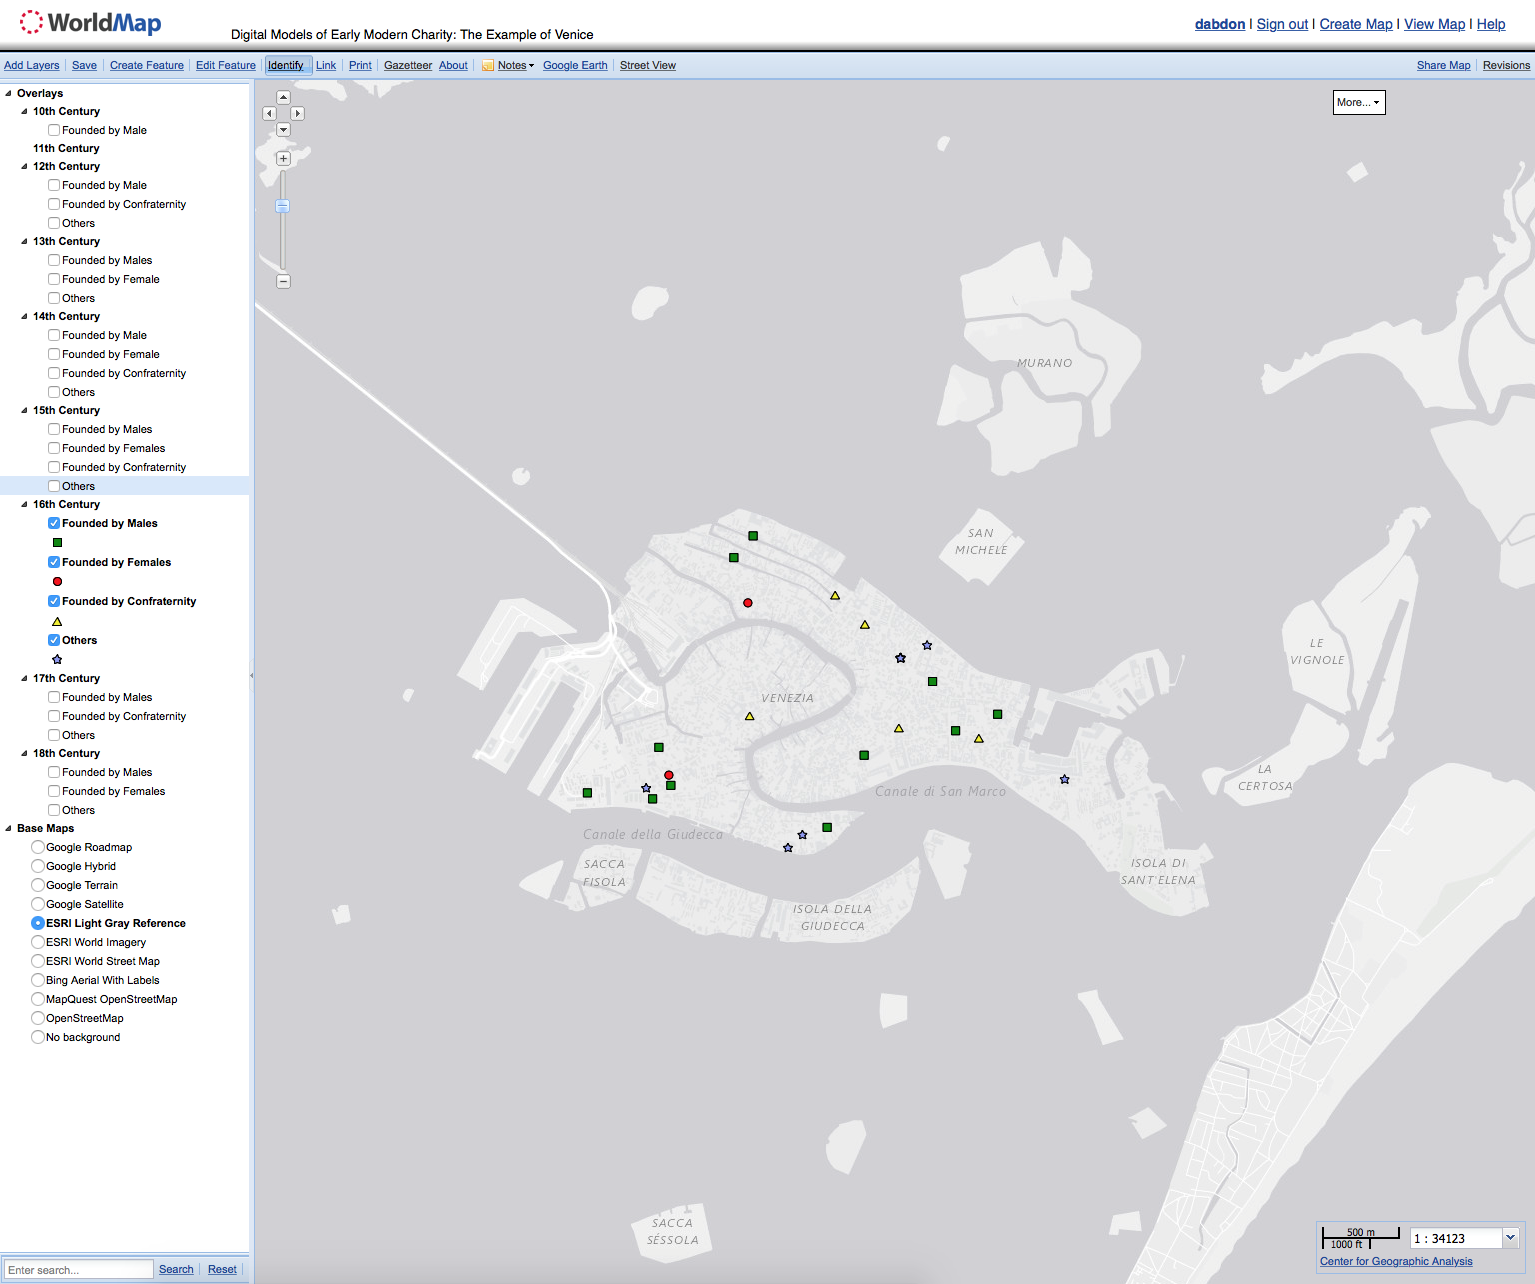
In the map, a box on the right allows users to select which century they would like to focus on, and one can visualize the foundation of charitable institutions according to the type of patron responsible for its establishment—men, women, confraternities, or other. Since my own research focuses on charitable patronage in Venice, I have used my HASTAC project extensively to visualize trends in the history of charity, patronage, and public health.
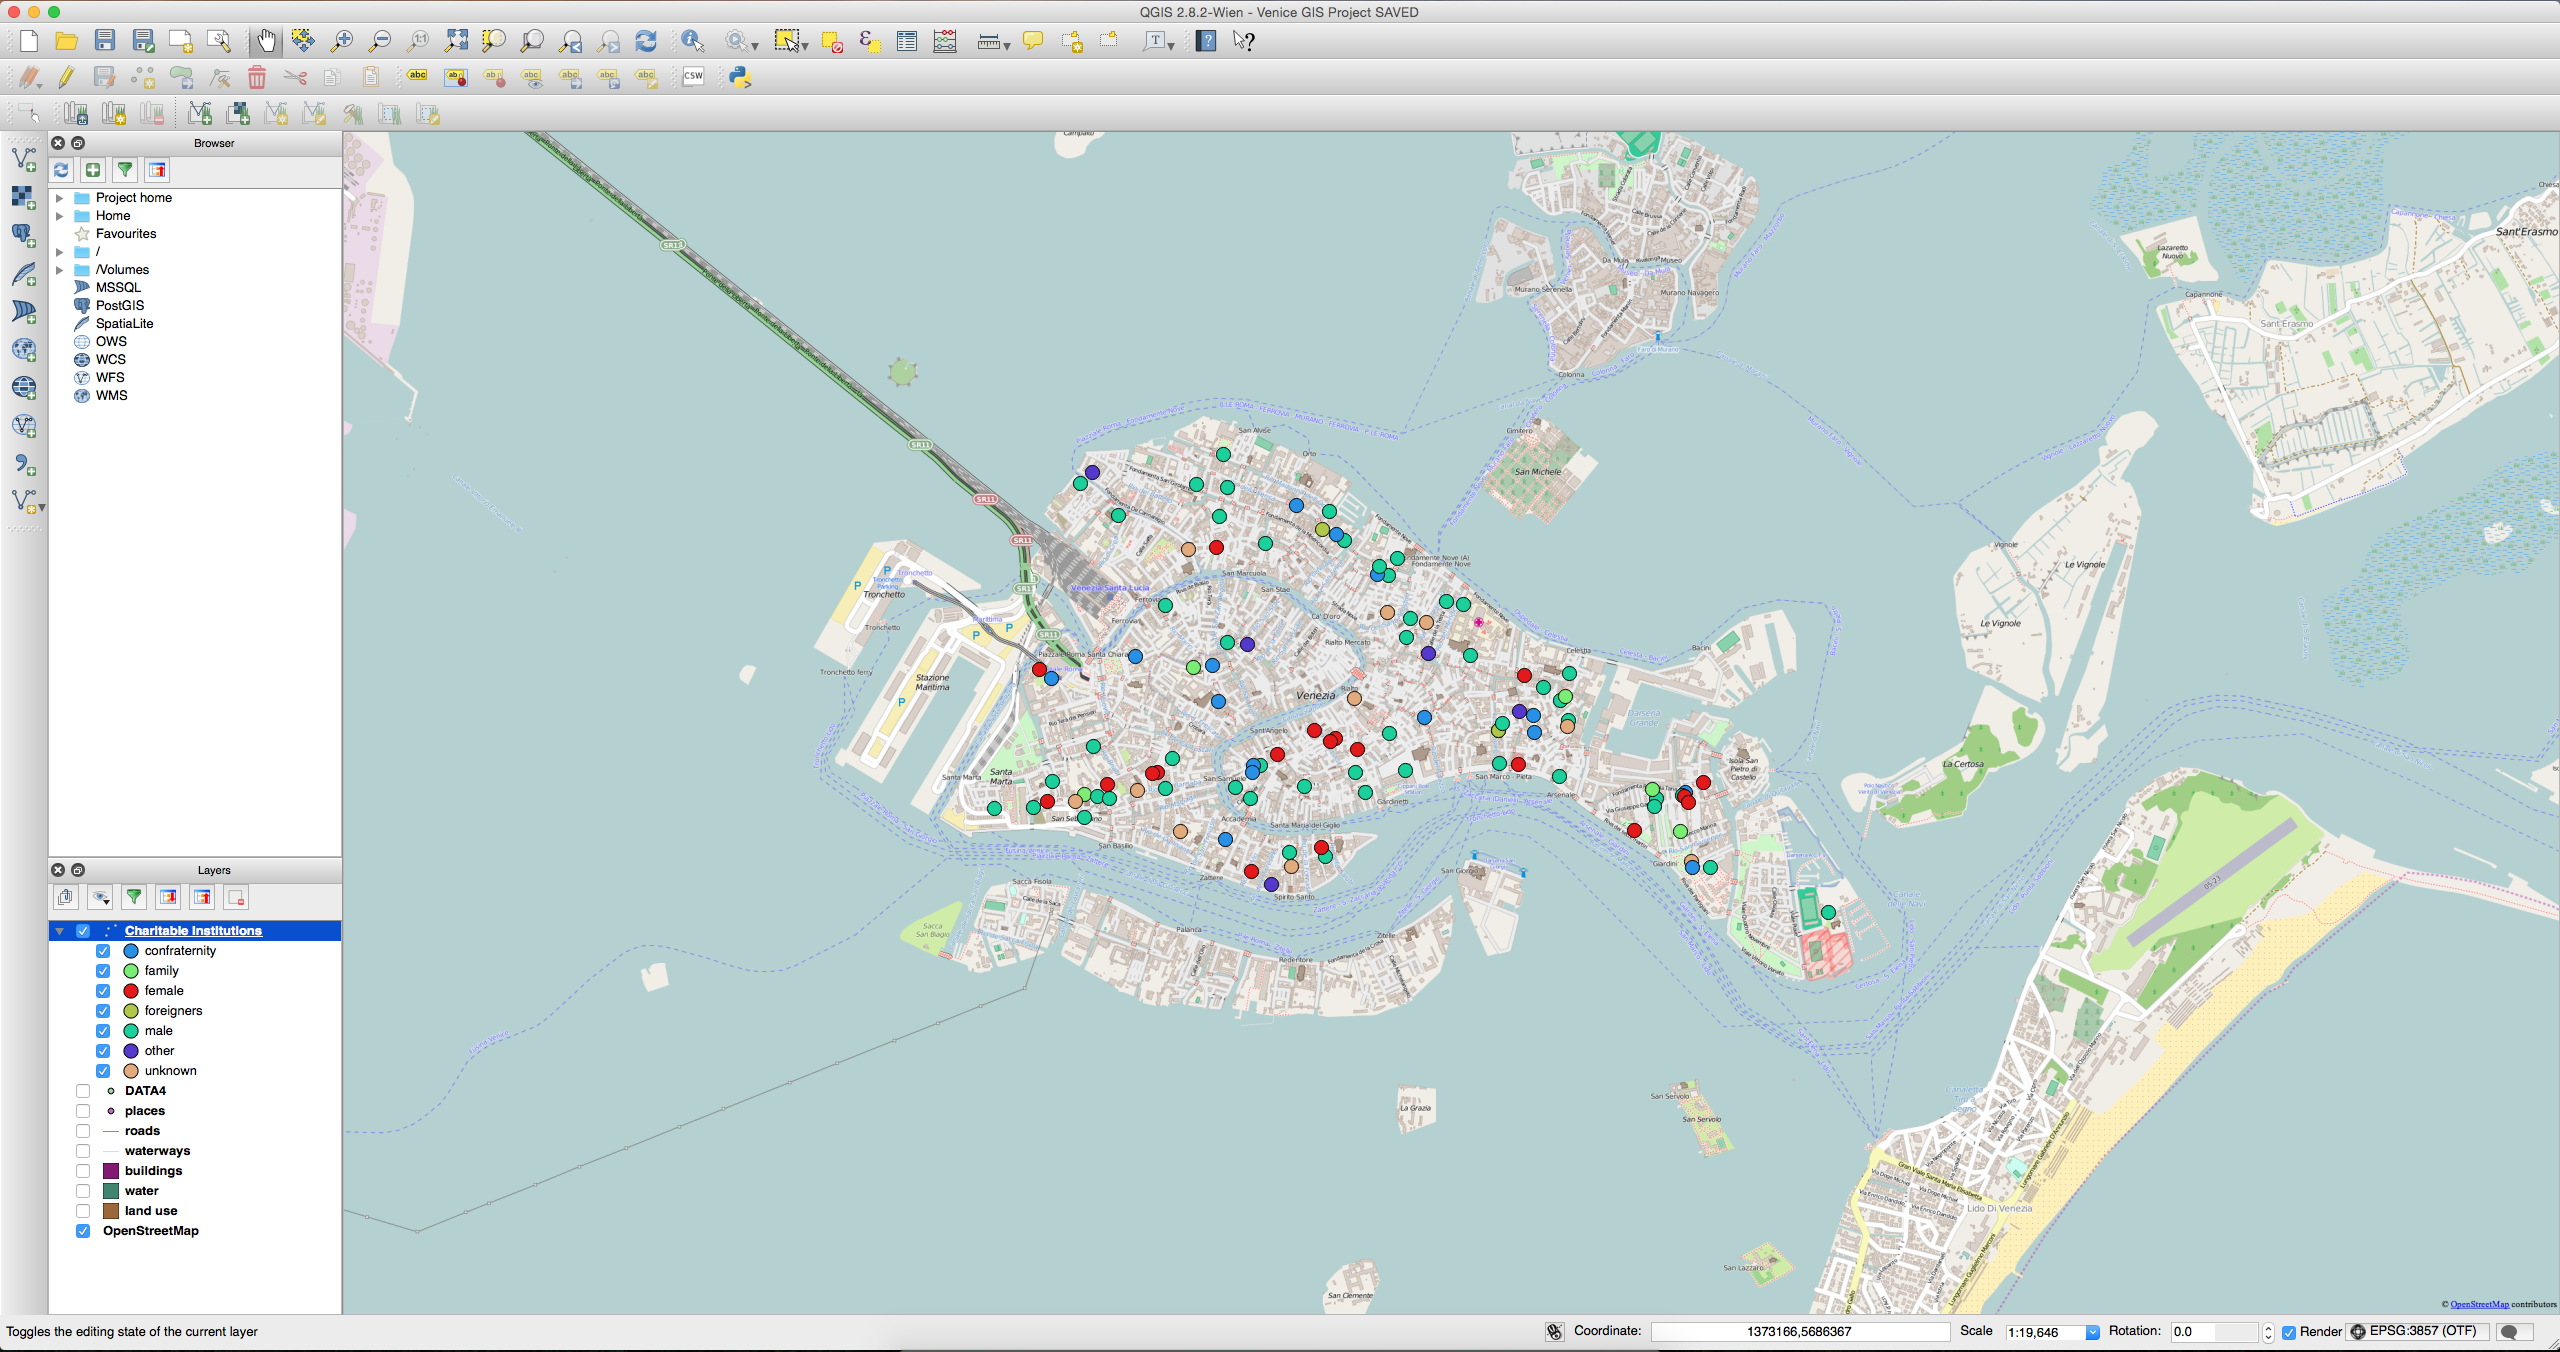
This summer, my goal is to employ this same material in order to learn how to develop a mapping project using Quantum GIS (QGIS), an open-source GIS application. While WorldMap had a more straightforward format and a lower learning curve, it limited the amount of information I could show—and how I was able to show it. Based on my initial explorations, QGIS will allow me more flexibility in visualizing spatial and temporal changes, in addition to displaying this information in a more visually-appealing manner.
So far, I have successfully imported my Excel spreadsheet into QGIS, and I am able to see the establishment of charitable institutions based on the type of patron. Since it is easy to make changes to the data through the spreadsheet, I made my initial WorldMap categories even more specific.
Using a plugin called TimeFrame, I can see the foundation of these institutions through time.
As this project progresses, I will continue to investigate other ways to explore and visualize my data, as well as different ways for users to engage with this material. Stay tuned!