By Angele M. Cirucci
Hello all! My name is Angela Cirucci, and I am currently a PhD Candidate in the School of Media and Communication as well as a summer graduate student worker in the Digital Scholarship Center. My research examines Facebook’s architectural affordances and their implications for identity creation, maintenance, performance, broadcast, and comprehension. More generally, I am interested in how the structures of social networking sites drive our identity performances and our perceptions of the world.
Here in the Digital Scholarship Center, I will be exploring methods for mining social networking data, analyzing findings, and visualizing the data in new and informative ways. Because another research interest of mine is questioning the ways in which media promote and describe “science,” I will be collecting tweets and networks regarding the hashtag #watchingcosmos–the hashtag implemented by those watching Fox’s Cosmos: A Spacetime Odyssey. I wonder what these tweets and their posters’ networks can tell us about the viewers of the series and their general stances on science, media, etc. I am also excited to perhaps compare these results to other shows such as Through the Wormhole or Family Guy. I can dive more deeply into my findings and learn who these tweeters are, where their states usually sit politically and religiously, and how the tweeter demographics compare to the overall viewership demographics reported through official ratings sources.
I thought that I could share a few things that I have learned in my first few days here in an effort to help people get a feel for what it is I do, or, to offer comfort to those of you who are working through the same preliminary hurdles–you are not alone!
Lesson 1: Browse around for other studies that generally match your research ideas. You may not, at this point, have an exact research question or hypothesis in mind. This is definitely a catch 22 in social media analysis–you must know your plan before you just go collecting data. But, at the same time, how can you know your plan if you don’t really know what is out there? Thus, I suggest that you first do a broad survey of similar research. Perhaps it is just research that explores the platform in which you are interested, or maybe it is research that uses a method with which you are familiar. Take some time to familiarize yourself with the norms in the field and also the up-and-coming techniques. For example, I knew that I was going to be analyzing Twitter this summer, but I wasn’t sure exactly where I would go with it. I took a day or so to browse Google Scholar and Temple’s library to get a sense for common trends. This doesn’t mean you have to stick with the expected or conventional, it just gets the process started.
Lesson 2: Play with some of the popular tools. Again, this step is important before you start your focused research. You don’t want to completely invest in a tool and then realize four weeks (or four months) in that you can’t use this tool and that you now must start from scratch. From your preliminary research you should have found at least three or four widely-used tools. Look these up online, download the free software, immerse yourself in the methods and options. Having a good understanding of some options will help you when you actually design your study. The nice thing about these widely-employed tools is that there will be A LOT of literature online–you will find video tutorials, step-by-step walk-throughs, write ups, reviews, etc.
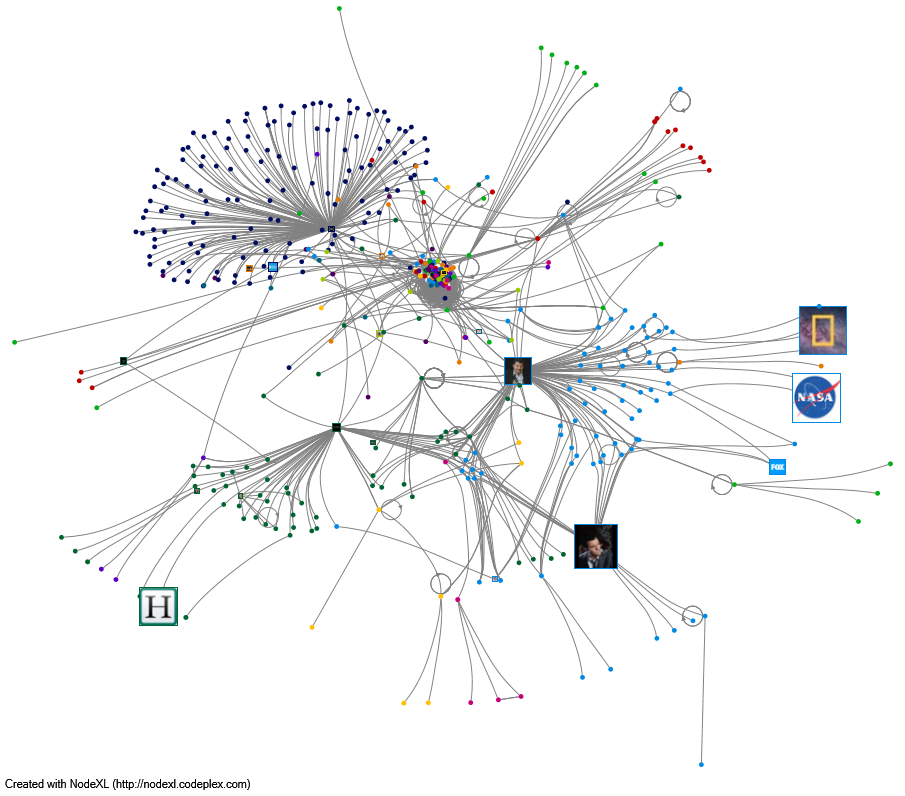
For example, below is an image displaying a small network analysis I conducted while learning NodeXL. I used #watchingcosmos as my Twitter search term.
Lesson 3: Chat with other people! One big lesson that I have already learned is how collaborative digital scholarship is, and inherently must be. People have different backgrounds, skills, and strengths. Although research projects regarding social media analysis can be done alone, it really doesn’t make sense to completely wall yourself off. Speak with others to learn about methods, techniques, theories, and tools. It is also great to ask others to discuss your research question or hypothesis ideas. At this point you have been so into your own project that you may not have enough critical distance to conceive of the most beneficial design possible. And, the project certainly will not be as wonderful designed alone as designed with others’ skills and ideas folded in.
Lesson 4: Design the project before you jump in. At this point you have now educated yourself regarding previous research, explored tool options, and bounced your ideas off of others in your field. Now, it is time to design your project. Before you jump in collecting millions of tweets or Facebook “likes,” you want to be sure you know what it is you are trying to answer. This step helps for many reasons. First, you won’t waste your time. Scraping data takes time, a lot of it. If you want to collect from Twitter’s streaming API, this is obviously live, so you have to wait your selected amount of time. If you want to analyze a Twitter network or access the RESTing API, there are certain rate limits. The site may make you wait fifteen minutes or an hour before more data is scraped. Or, they may just cut you off at, say, a thousand tweets. Second, you won’t really know which tool to use or which methods to apply unless you know the questions that you are trying to answer. Of course some new caveats will reveal themselves as you move forward, but it is best to have a solid design from the start.
Thanks for reading my introductory post. I look forward to sharing my process with you.
Blog post on deck: my search for a Twitter scraping tool!!