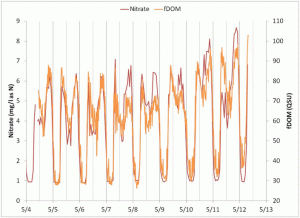
Trevor and I have been trying to figure out what the nitrate signal at the water treatment plant (WTP) looks like. We have data downstream that looks like a diurnal signal with some funky switches. Does the WTP have a funky source term? We moved my nitrate logger upstream to the WTP and found out that the nitrate signal and the fDOM (fluorescent dissolved organic matter) look the same. This pattern will help us interpret our data because we have a regular fDOM signal downstream and it doesn’t look at all like the nitrate signal Thus, the WTP isn’t the source of our funky switches!
Here is a nice plot showing nitrate and fDOM from the WTP have the same signal
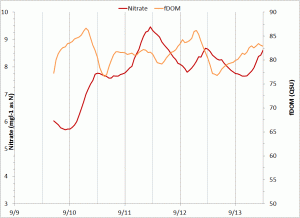
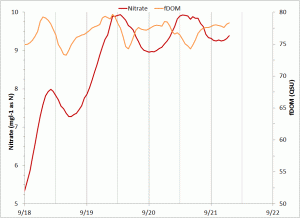
Below are a couple of plots of the offset (“funky”) fDOM and nitrate signal from September 8 km downstream of the WTP


