I have just returned from 5 days in Seattle, Washington to attend the 2014 Library Assessment Conference: Building Effective, Sustainable, Practical Assessment. This is a biennial gathering (now 600 attendees strong) and is sponsored by the Association of Research Libraries and the University of Washington.
The conference presents a fantastic opportunity to network with other professionals, learn about new tools, and keep up with trends in the library assessment and measurement community. It was especially fun for me to catch up with colleagues from past workplaces, including Syracuse, New Mexico State University and even the University of Louisville.
While I encourage you to explore the slides/presentations being posted at the conference site (http://libraryassessment.org/schedule/index~print.shtml), here are some of my personal highlights:
Using data analytics for prediction
Data is big. Several presenters encouraged librarians to pay attention to the higher education trend of using learning analytics to more proactively support student and faculty work and demonstrate value. Both Deb Gilchrist (Pierce College ) and Margie Jantti (University of Wollongong) spoke to the need for libraries to be more assertive in collecting data. Jantti’s research findings indicate, for instance, that students who do not use electronic resources will, on average, fail.
Gilchrist reminds us that we can get mired in descriptive analytics, and our time may better be spent thinking about predictive analytics. We need to think within the institutional context and proactively consider trends in higher education. She suggests that we might need to give up some of our principles for privacy – citing the example of Minnesota’s use of its Assignment Calculator (research paper analytics) to intervene at key points. She goes on to ask the question, “What would intrusive reference look like?”
Data Tools
Based on several powerful demonstrations of Tableau for presenting library data, I can’t wait to re-acquaint myself with this powerful tool for data visualization. Sarah Murphy was able to share some of her work on the public site at: https://carmenwiki.osu.edu/display/libraries/Dashboards. Rachel Lleweyan (UMass Amherst) and Jeremy Butler (University of British Columbia) also described best practices using Tableau dashboards to answer specific questions, provide multiple views of a single data set, and to generate new questions.
Space and Services
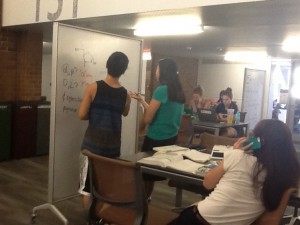
The University of Washington is a beautiful campus and this conference shows it off to advantage – both the physical spaces and the work of library staff. I particularly loved the newly renovated Odegaard Undergraduate Library with its open floor plan (that also accommodates quiet study), its active learning spaces with writable glass walls that can be adjusted for class use or open lab.
This picture shows so much going on in one of the new spaces, both analog and digital technologies in use. And I was excited by Lauren Ray (University of Washington) and Katharine Macy (Tulane) account (Assessment of Space Designed for Experimentation) of the Research/Writing Center that is a partnership between the writing center and the reference services. Students can walk in or make appointments to consult with librarians and tutors to get support for writing and researching papers. There is natural linkage between these two services, and providing support to students in a shared space benefits everyone. The Scholar’s Studio is space that provides services for graduate students – they’ve experimented with lightening round research presentation events and a CoLab event designed to foster interdisciplinary collaboration.
Strategic Direction and How We Measure Our Progress
A key theme throughout the conference was demonstrating value and connecting library strategic direction with institutional goals. Roger Schonfeld (Ithaka S&R) addressed this in Vision, Alignment, Impediments, Assessment : The Views of Library with reactions from Anne Cooper Moore (Southern Illinois) and Scott Walter (DePaul).
Ithaka S&R conducts triennial surveys of faculty, their views on the library’s role in their work. They recently conducted a survey of academic library directors, and Schonfeld presented some results from this research, suggesting possible mis-alignment in how the role of the library is perceived by faculty and by library directors. While faculty value the library’s role as buyer, archive and as gateway to information, library directors see the support for research and teaching as of primary value, as well as the increasing support for information literacy. Moore and Walter provided additional context from the library directors’ vantage point – that many schools are focusing on the needs of undergraduates, needs that may differ from faculty. These directors describe a library role that takes into account institutional missions as well as a role that serve the needs of faculty more directly.
By day 3, my head was exploding, but fortunately the slides are available for Steven Town‘s (University of York) provocative whirlwind presentation, Making a Value Measurement a Reality: Implementing the Value Scorecard.
He extends the balanced scorecard approach further to explore the measurement of library values in the dimensions of relational capital, library capital, library virtue and library momentum. For example, the library provides the university with relational capital that can be measured by its competitive position (reputation beyond institutional boundaries). In the dimension of virtue, the library’s contribution to research, learning and employability of students might be measured. According to his paper (with Martha Kyrillidou, Developing a Values Scorecard), the value scorecard “provides a framework and categorization for the types of evidence required to prove the value and impact of libraries.”
Lastly – the coffee! There wasn’t lots of extra time, but I did my best to assess the options. My favorite – Cafe Solstice.


