By Nicole Lemire-Garlic
Identifying Similar YouTube Videos by Comparing Metadata in R – Part 2
In my last post, I described my YouTube-recommended video pilot project. This project assesses the similarity between a UNICEF child poverty video and the “related” videos recommended by YouTube’s algorithms. This project is connected to my dissertation work on the ethics of communicating social justice through YouTube.
Recommended videos appear on the right hand side of the YouTube viewing screen. The list of videos is automatically generated by YouTube’s algorithms. Because YouTube keeps its algorithms secret, the inner workings of the algorithms are unknown. What we can guess is that the algorithms probably take into account many factors, including the number of likes and dislikes a video has garnered, the time a viewer has already spent watching videos, the subject matter and newness of the potential recommended videos, the user’s watch history, and more.
For non-profit or government organizations looking to reach YouTube users, they can look carefully at the recommended video lists to see what additional content their viewers may be exposed to during their viewing session. In this post, I will demonstrate the custom dictionary approach I used in R to do just that.
I followed a three-step process: collecting and cleaning the metadata, creating and applying the custom dictionary, and visualizing the results.
Collecting and Cleaning the Metadata
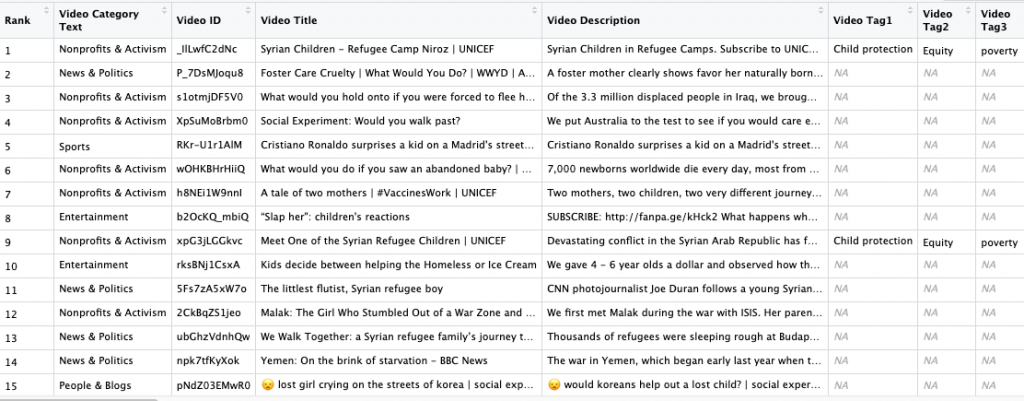
To collect the data, I used R’s tuber package to access YouTube’s Data API. After obtaining credentials to access the API, I used tuber’s functions to gather the metadata for the UNICEF video and the recommended videos (n = 50). The metadata included video channel title, video ID, video title, video category, video description, and video tags.
This alone created a rich set of metadata for each recommended video, but I added a few more calculated fields for my purposes. I added Rank to capture the placement of the recommended video on the screen (1 = first recommended video at the top of the screen). My hunch was that, based on YouTube’s advertiser-driven business model, a disproportionate amount of popular videos would be placed in the top (1 – 5) recommended videos. To test this, I added a Popularity variable, using view count (the number of times a video has been viewed) as a proxy.
Here is what the completed data frame looked like. You can’t see the full data frame here because there were over 650 unique tags! Wrangling the tags was one of more challenging aspects of this coding project. For more details on how I accomplished the data wrangling, check out my Github repository for step-by-step instructions in the R code.
To apply the dictionary described below, I combined the video title, description, and tags into one column. I pre-processed this text data to remove digits, extra spaces, punctuation, and NA values. I also converted the data to lowercase and lemmatized it with the lemmatize_strings function from the textstem package.
Creating and Applying the Custom Dictionary
As explained in my last post, a dictionary approach to text analysis involves searching for pre-selected, meaningful terms in a body of text. I developed a coding scheme with three types of dictionary entries─organization, issue, and hashtag-based─and gave the recommended video a point for each type. Altogether, a recommended video could earn between 0 (Not Similar) and 3 points (Very Similar).
| Dictionary Category | Dictionary Term | Points |
| Organization | “UNICEF” | 1 |
| Issue | “child” and “poverty” | 1 |
| Hashtag | “#fightunfair” or “#foreverychild” | 1 |
Although the lemmatization was helpful, it did not convert all the terms relevant to my analysis. So, when writing the code, I used the OR operator ( | ) to search for terms with similar meanings. For example, when searching for matches to “child”, I searched for “girl”, “kid”, “teen”, etc. I used str_detect from the Tidyverse’s Stringr package to search for the terms and output the results into one final data frame.
Visualizing the Results
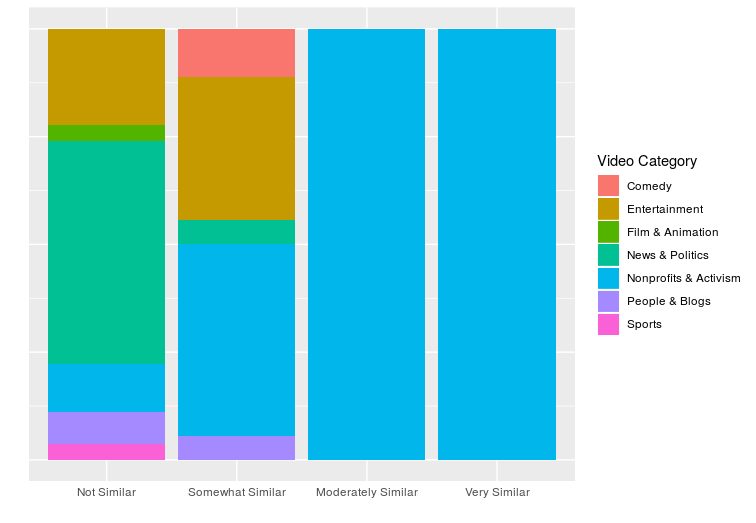
Video Categories and Similarity
As mentioned in my last post, my hunch was that video from the same category would not necessarily contain similar content. However, as this ggplot2 visualization shows, the higher levels of similarity were entirely made up of the same category as the UNICEF video: Nonprofit & Activism. This may have been an idiosyncratic finding for nonprofit videos. It would be interesting to test an initial video from a broader YouTube category, like News & Politics or Entertainment, to compare results.
Popularity and Recommended Video Placement
I noted above that I expected popular videos to be disproportionately placed in the top recommended videos. Recall that Rank refers to how a user would encounter recommended videos on a screen. Because users eyes are drawn first to the recommended videos near the top, I recoded the Rank variable into “Top” (rank #s 1-5). I then broke up the remaining ranks into “Middle” (6-15), and “Bottom” (16-50). Recognizing that YouTube views for a single video can exceed a billion, I recoded Popularity as: “Unpopular” = 0 to million views, “Popular” = 1 million views, and “Very Popular” = 5 million views.
This visualization suggests that Very Popular videos are disproportionately represented in the Top recommended videos. And, unpopular videos are more heavily represented in the Bottom. It would be interesting to see if this holds over time. With the R script, this would be easy to do. You could run it multiple times a day for a series of days on the same initial video.
![]()
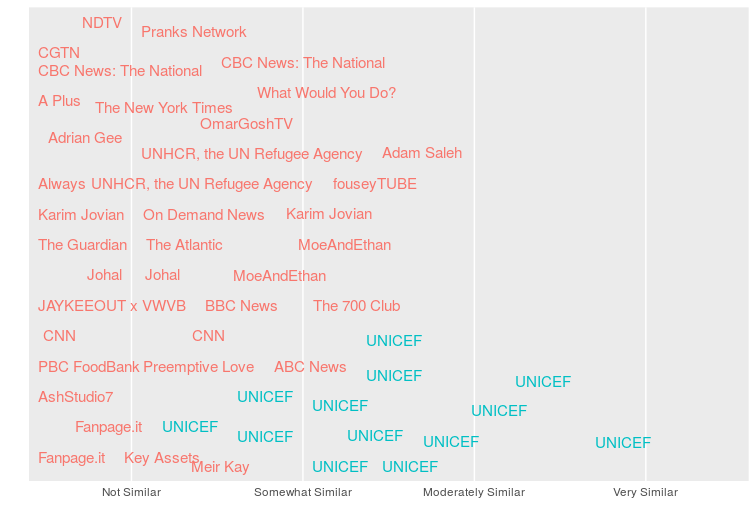
Channel Title and Similarity
Another question I explored was whether only those videos produced by the same creator would be Moderately Similar or Very Similar to the initial video. This visualization shows that the Moderately Similar and Very Similar videos were created by UNICEF. This is, in part, because the dictionary coding scheme gave an additional point to videos made by the same creator. In future work, it would be interesting to test a dictionary approach that does not include organization matches.
Through this pilot project, I explored on a small scale what can be gleaned from studying YouTube metadata for recommended videos. Because this project used the list of recommended videos generated by the YouTube API, it only mimics what a non-logged in user would see on their screen. My future work will expand on this approach by analyzing personalized recommended video lists.
You may find the full R code for this project on Github. Be aware that you will need to use your own YouTube API OAuth credential to run the code. For more on setting up the credential, check out this YouTube API post or follow the detailed instructions on my Github repository.