By Luling Huang
Problem defined:
I have a set of 17 user-provided political ideological labels (e.g., Libertarian, Moderate, Liberal, Centrist, etc.). Each label has a document containing the user-generated textual data contributed by the users who selected that label. How do I determine how different or distant the labels are based on the textual data? And, based on the pairwise distances, how do I check, for example, whether Socialist is relatively closer to Liberal than to Conservative?
Why is the problem significant?
My goal is to develop a new measure for cross-ideological and within-ideological relationship between two users, given the data I have. A previous similar project used a rough, common-sense approach to recode the ideological labels into Left, Centrist, and Right (Liang, 2014). The first problem of such a rough approach is that the precision of the measure can be doubted due to the perceivable diversity within each of the three large recoded labels (i.e., Left, Centrist, and Right). That is, to what extent is it plausible to assume that the relationship between a communist and a liberal is within-ideological? The second problem is that the contents of what users say in political discussion are ignored. To what extent is it reasonable to argue that people select whom they talk to, as they merely attend to the user-provided cues (i.e., the ideological labels), but not as they attend to the actual contents of what others are saying?
Task and some benefits:
So, what I wanted to do was to empirically determine how distant the 17 ideological groups are based on the textual data. Hierarchical clustering seems to be an appropriate unsupervised text mining method to study the defined problem. At the current stage, I think there are two types of data that will be useful from hierarchical clustering. The first one is the quantitative data of a 17 by 17 distance matrix, which is required during the hierarchical clustering process. The second one is the qualitative grouping output at the end of the hierarchical clustering process.
Steps:
a. Represent the documents in a vector space model. The logic was explained in one of my previous post on cosine similarity. In brief, create a document-term matrix.
b. Weight the raw document-term matrix by tf-idf. The logic was also explained in the same post mentioned in Step a.
c. Calculate the Euclidean distances between any two documents.
d. Perform hierarchical clustering on the distance matrix created in Step c with a bottom-up approach. The general logic: 1. Treat each document as one cluster initially; 2. Find the most proximate two documents based on the distance matrix and group them as one cluster; 3. Create a new distance matrix; 4. Repeat Step 2 and Step 3 until all documents are in one cluster. Note that different algorithms (and complexity, of course) kick in in Step 3 regarding how the new distance matrix is calculated. The procedure in the following R script used Ward’s method (see more details in the documentation of hclust in R). I found this lecture notes (Greenacre, 2008) with numerical examples very helpful to understand hierarchical clustering.
Some R code:
1 2 3 4 5 6 7 8 9 10 11 12 13 14 15 16 17 18 19 |
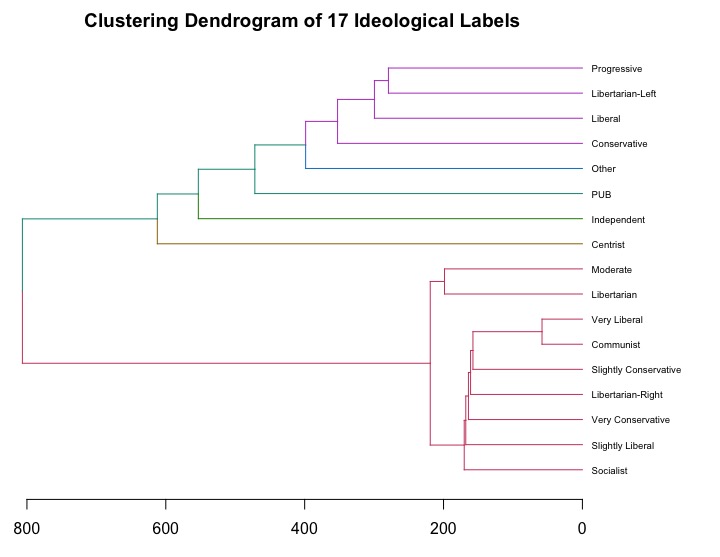
library(tm) library(dendextend) # Steps a & b tfidfdtm <- DocumentTermMatrix(corpus, control = list(bounds = list(global = c(2, Inf)),weighting = function(x) weightTfIdf(x, normalize = FALSE))) # Step c d <- dist(tfidfdtm, method="euclidian") # Step d hc <- hclust(d, "ward.D") # Visualization dend <- as.dendrogram(hc) labels(dend) <- labels.txt[order.dendrogram(dend)] dend <- set(dend, "labels_cex", 0.6) dend <- color_branches(dend, k = 6) par(mar = c(3,0,2,6)) plot(dend,horiz = T,main = "Clustering Dendrogram of 17 Ideological Labels") |
Note that between Line 2 and Line 5, for space saving, I omitted a large chunk of code. The omitted code created a corpus object containing 17 documents, and applied the standard text-preprocessing procedures (see the documentation of the tm package in R). And on Line 15, labels.txt is a list that contains the 17 ideological labels.
Dendrogram colored by 6 clusters:

“PUB” is the combined document for Private, Undisclosed, and Blank. Careful considerations need to be made when we interpret the meaningful clusters, which relates to what algorithms your clustering uses. Also, validation is also crucial for evaluating an unsupervised technique like hierarchical clustering. However, for an exploratory analysis, we can now have some clues answering the example question I raised in the beginning of this post: Is Socialist relatively closer to Liberal than to Conservative? Well, the clustering based on the empirical user-generated textual data revealed that Socialist is close neither to Liberal nor to Conservative.