Skip to content

Loretta C. Duckworth Scholars Studio

⠀

Menu
  • Scholars Studio Blog
    • Digital Methods
      • coding
      • critical making
      • data visualization
      • digital pedagogy
      • immersive technology (AR/VR)
      • mapping
      • textual analysis
      • web scraping
    • Disciplinary Fields
      • Anthropology
      • Archaeology
      • Architecture
      • Art History
      • Business
      • Computer Science
      • Critical Digital Studies
      • Cultural Studies
      • Dance
      • Economics
      • Education
      • Environmental Studies
      • Film Studies
      • Gaming Studies
      • Geography
      • History
      • Information Science
      • Linguistics
      • Literary Studies
      • Marketing
      • Media and Communication Studies
      • Music Studies
      • Political Science
      • Psychology
      • Public Health
      • Sculpture
      • Sociology
      • Urban Studies
      • Visual Art
    • Cultural Analytics Practicum Blogposts
  • Current Staff
  • Newsletter
  • About
    • Games Group 
Menu
wordcloud of tweet content from #watchingcosmos during the show's finale

#watchingcosmos Part Two

Posted on December 9, 2014August 26, 2019 by


By Angele M. Cirucci

As I mentioned in Part One, I conducted a project to better understand who was watching Cosmos and participating in the Twitter conversation using the designated hashtag “#watchingcosmos.” The first part of my research consisted of live-scraping tweets that were posted during the final episode. I applied a spring-loaded algorithm to my scraped data and created a telling network map of those who had tweeted and those who were “mentioned” in tweets.

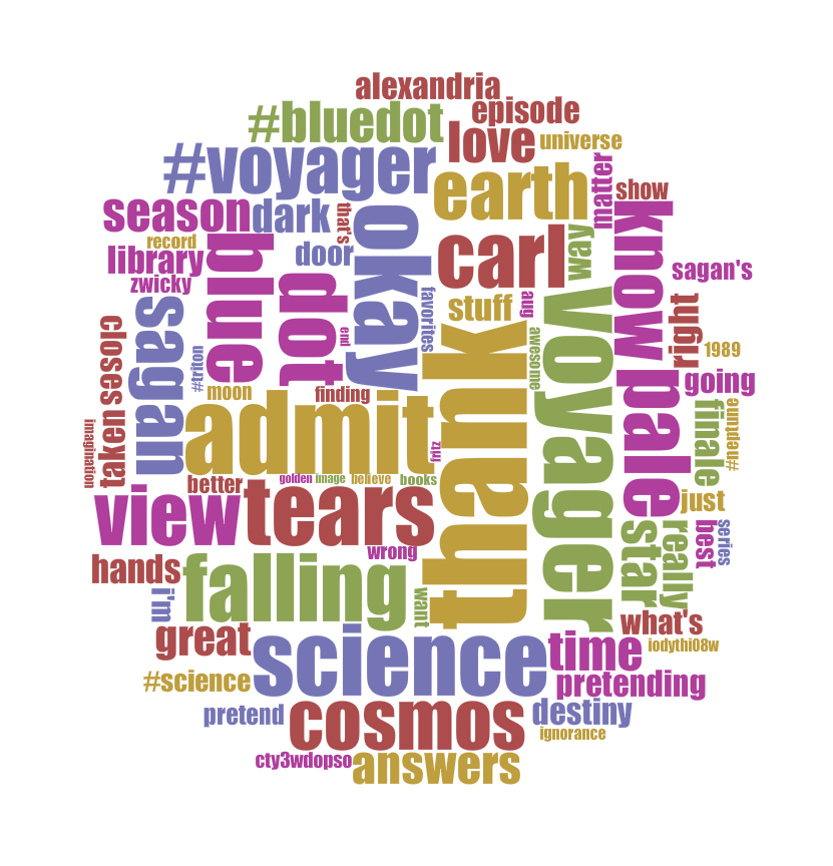
Although the networking analysis provided me with some information, I decided that a qualitative analysis was needed to better interpret how and why people were tweeting during the finale. I first dropped all of the tweet content into Voyant and created a word cloud. From this quick, preliminary analysis, I could see that tweeters were likely to be thanking the show’s creators and posting about their sadness regarding the show ending. We can also see that some of the topics of that episode were mentioned.

wordcloud of tweet content from #watchingcosmos during the show's finale
#watchingcosmos tweets

The context was still a bit vague for me, so I made the decision to conduct a more traditional content analysis of each tweet. Thus, I completed multiple readings of the tweets and allowed themes to emerge. As you can see in the below bar graph, the most prevalent tweet type was “praise”–thanking the creators of the show, tweeting about how great the show is, expressing sadness that the show was ending, etc. The next most prevalent tweet type was “quote”–tweeters often would directly quote the show, not adding any commentary or opinion. The third most prevalent type was “info”–this theme captures the tweets that provided related, auxiliary content. For example, if Cosmos was discussing Voyager 1, a tweet under this theme may be something like “”The Pale Blue Dot. Voyager 1’s view of Earth in 1990 #watchingcosmos #cosmosfinale #bluedot #voyager #cosmos http://t.co/hwWDqVJwGW” where the link points to an actual picture taken by Voyager 1.

a bar graph displaying the frequency of tweet types--praise, quote, info, commentary, about, watching, joke, religious, other
Type of Tweet

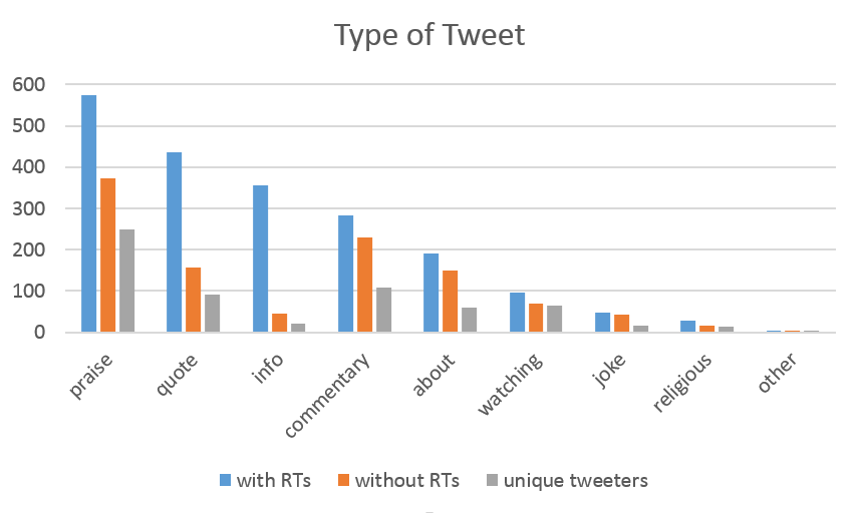
We can also see that the info tweets were very likely to be retweeted, but that, at the same time, number of unique tweeters is very low. This seems to suggest that a few viewers were tweeting auxiliary information and many tweeters were distributing this content to their own networks.

To make my analysis much more dynamic and powerful, as a last visualization step, I combined my network analysis with my more traditional, content analysis–I kept the network, spring-loaded map, but I changed the colors of the nodes to represent the tweet type.

network map of Cosmos tweeters with codes colors by tweet theme
Network with themes

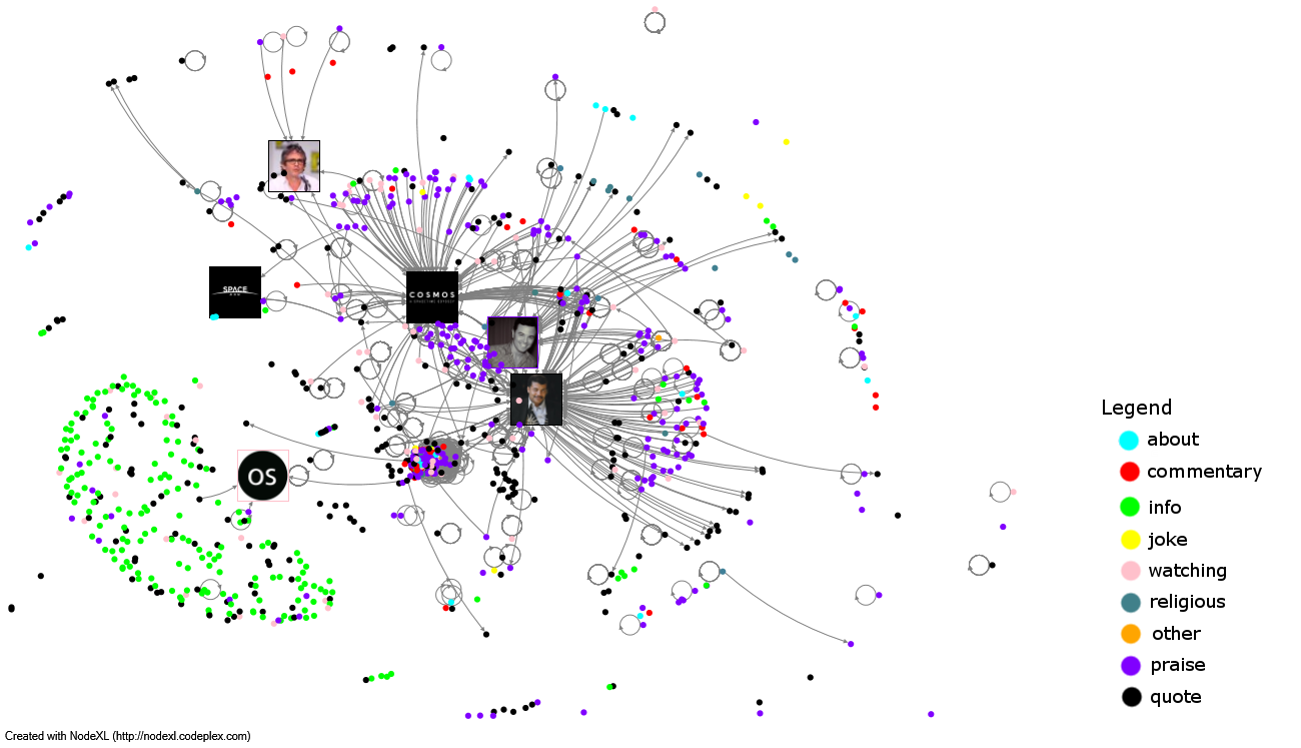
With this new visualization, I can share some preliminary findings.

1. Tweeters were most likely to praise the show. This is potentially a product of that fact that I scraped during the finale. My future research will compare these results to those of tweets that I scraped during the penultimate episode.

2.  Tweeters are next most likely to quote the show without adding any other information. While at first we may see this as a negative aspect–tweeters are not thinking critically about the content, just repeating the show’s narration–we can also see it as a positive. Tweeters are still disseminating scientific information to their followers who may not be watching the show themselves.

3.  Complementary information was mostly tweeted by one account. Almost all of the “info” tweets were sent by the Observing Space account. Again, we may at first feel inclined to view this as a negative–few are attempting to link the show’s information with related research. However, we also know from this map and the bar graph that many users were retweeting this information. This act highlights the power of Twitter and why it is salient to investigate the practices and their implications for TV shows and spreading scientific content. First, remember that the users who are retweeting this additional information do not have to normally follow this account; they may just be following the hashtag and thus receiving this information. Further, they are retweeting and thus sharing and disseminating scientific knowledge with their followers, who of course do not have to be watching the show…or even know what the show is.

4.  Neil and Seth are not really that connected (to each other) in our network map. This basically means that people who are mentioning Neil are not necessarily also mentioning Seth, and vice versa. Why? Can we assume that people who are followers and fans of Neil are not likely to care about Seth and vice versa? Does this say something about the normal Fox viewer (e.g., Family Guy) compared to the viewer just tuning in for Cosmos?


Leave a Reply

You must be logged in to post a comment.

Recent Posts

  • The Untold History of Fletcher Street’s Stables April 21, 2025
  • Building an Immersive Archive of the Greek Orthodox Churches in Istanbul April 15, 2025
  • Tracing Influence in Genealogies of Communication Theory April 14, 2025

Tags

3D modeling 3D printing arduino augmented reality banned books coding corpus building critical making Cultural Heritage data cleaning data visualization Digital Preservation digital reconstruction digital scholarship film editing game design games gephi human subject research linked open data machine learning makerspace makerspace residency mapping network analysis oculus rift omeka OpenRefine Photogrammetry Python QGIS R SketchUp stylometry text analysis text mining textual analysis top news twitter video analysis virtual reality visual analysis voyant web scraping webscraping

Recent Posts

  • The Untold History of Fletcher Street’s Stables April 21, 2025
  • Building an Immersive Archive of the Greek Orthodox Churches in Istanbul April 15, 2025
  • Tracing Influence in Genealogies of Communication Theory April 14, 2025

Archives

Meta

  • Log in
  • Entries feed
  • Comments feed
  • WordPress.org

Archives

Blog Tags

3D modeling (11) 3D printing (14) arduino (8) augmented reality (5) banned books (3) coding (12) corpus building (4) critical making (7) Cultural Heritage (11) data cleaning (4) data visualization (11) Digital Preservation (3) digital reconstruction (9) digital scholarship (12) film editing (3) game design (3) games (6) gephi (3) human subject research (3) linked open data (4) machine learning (6) makerspace (8) makerspace residency (4) mapping (30) network analysis (17) oculus rift (8) omeka (3) OpenRefine (4) Photogrammetry (5) Python (8) QGIS (10) R (9) SketchUp (4) stylometry (8) text analysis (10) text mining (4) textual analysis (32) top news (102) twitter (5) video analysis (4) virtual reality (17) visual analysis (5) voyant (4) web scraping (16) webscraping (3)

Recent Posts

  • The Untold History of Fletcher Street’s Stables April 21, 2025
  • Building an Immersive Archive of the Greek Orthodox Churches in Istanbul April 15, 2025
  • Tracing Influence in Genealogies of Communication Theory April 14, 2025
  • From Theory to Practice: Weaving in Response to the Grid in the Global Context March 26, 2025
  • Visiting a Land of Twilight February 24, 2025

Archives

©2025 Loretta C. Duckworth Scholars Studio | Design: Newspaperly WordPress Theme
Menu
  • Scholars Studio Blog
    • Digital Methods
      • coding
      • critical making
      • data visualization
      • digital pedagogy
      • immersive technology (AR/VR)
      • mapping
      • textual analysis
      • web scraping
    • Disciplinary Fields
      • Anthropology
      • Archaeology
      • Architecture
      • Art History
      • Business
      • Computer Science
      • Critical Digital Studies
      • Cultural Studies
      • Dance
      • Economics
      • Education
      • Environmental Studies
      • Film Studies
      • Gaming Studies
      • Geography
      • History
      • Information Science
      • Linguistics
      • Literary Studies
      • Marketing
      • Media and Communication Studies
      • Music Studies
      • Political Science
      • Psychology
      • Public Health
      • Sculpture
      • Sociology
      • Urban Studies
      • Visual Art
    • Cultural Analytics Practicum Blogposts
  • Current Staff
  • Newsletter
  • About
    • Games Group