
By Angele M. Cirucci
This summer, beyond exploring Twitter mining, visualization, and analysis tools (see my guide here), I was also working on my own research project utilizing some of these tools and methods.
A research area that interests me is the convergence of science and popular media. In particular, I am interested in the ways in which media portray scientific findings and how the general public responds. Many scholars have deemed the US “unscientific.” They argue that Americans are not really interested in science. Instead, they claim that Americans pay more attention to celebrities and popular culture (e.g. reality television) and less attention to scientists and pressing issues (e.g. climate change).
I decided to look at the distinctive serious Cosmos: A Spacetime Odyssey because it combines popular culture with science. The show is hosted by Neil deGrasse Tyson, co-produced by Family Guy creator Seth MacFarlane, and aired on Fox. By mining tweets using the designated hashtag #watchingcosmos during the series finale, I began to explore questions such as: Who is watching and live-tweeting Cosmos?; What is the potential Twitter audience for Cosmos tweets?; About what are viewers tweeting?; How do emergent tweet themes coincide with religious and political affiliations across the country?; How do these tweets and networks compare to those regarding another popular science show—Through the Wormhole (hosted by Morgan Freeman) or another Fox show—Family Guy?; Is airing the show on the Fox network drawing in an unexpected demographic?; and Can we glean anything about the “scientificness” of Americans through this analysis?
I collected tweets that contained “#watchingcosmos” during the season finale of Cosmos on June 8, 2014 through the Twitter Streaming API. I did this through Ruby and a customized script that I wrote to pull only the information that I would need for my study. The script ran from 9pm EST (when the show began on the East Coast) until 6am EST the following morning, capturing tweets across timezones. I then entered this information into NodeXL.
I began my analysis with a visualization of the Twitter #watchingcosmos network.
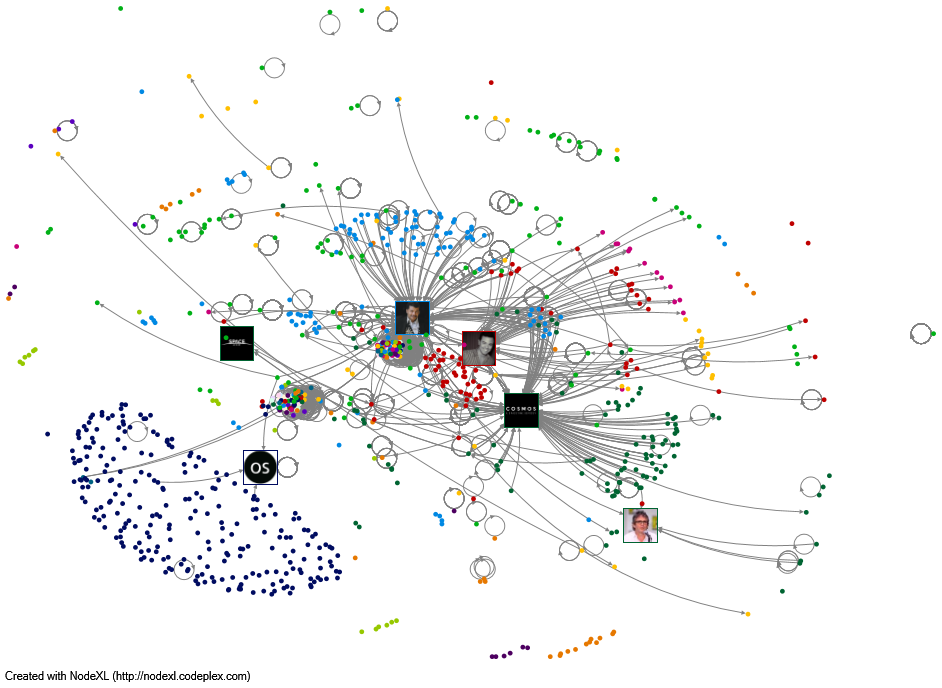 Each node (dot) represents a user while the edges (connecting lines) represent a tweet relationship–if a user mentioned or replied to another tweeter. Edges that circle back to the originating node represent tweets that contain no usernames. I have applied the Harel-Koren Fast Multi-Scale algorithm. This is a spring-loaded network algorithm–nodes attract similar nodes and repel dissimilar nodes. The nodes are also colored to represent the groups to which they belong. (I used the Clauset, Newman, & Moore algorithm for this. Again it is a way to cluster nodes into communities based on network relationships.) The users with the most followers are represented by their Twitter profile picture. I have also hidden the edges that represent retweets (RTs). Therefore, the edges shown are only those tweets that are original.
Using this initial analysis we can see that the expected users are represented the most in our sample. Neil DeGrasse Tyson, Seth MacFarlane, Cosmos’ Twitter account, among others, have the most followers and are also central to our mapping. This doesn’t mean that they tweeted often. In fact, because we can see the directed edges pointing to these users, we know that other tweeters have mentioned them in their tweets. This is a practice in which many tweeters participate–it allows more people to see their tweets and is an attempt to get the celebrities or important accounts to interact with them.
We can also see from this map that @observingspace, the node in the bottom left-hand corner with the black circle and “OS” profile picture has many, slightly unrelated nodes from the rest, that are almost all RTs. This is because @observingspace does not often tweet about the show itself, but instead provides related information as the show is airing. Thus, people just RT the informational tweets. However, to know this I had to do more than just look at the above visualization.
In Part Two of this blog, I will discuss how I continued my analysis with some qualitative methods.