By Austin Martin
City Landscapes as Havens for Declining Bee Populations
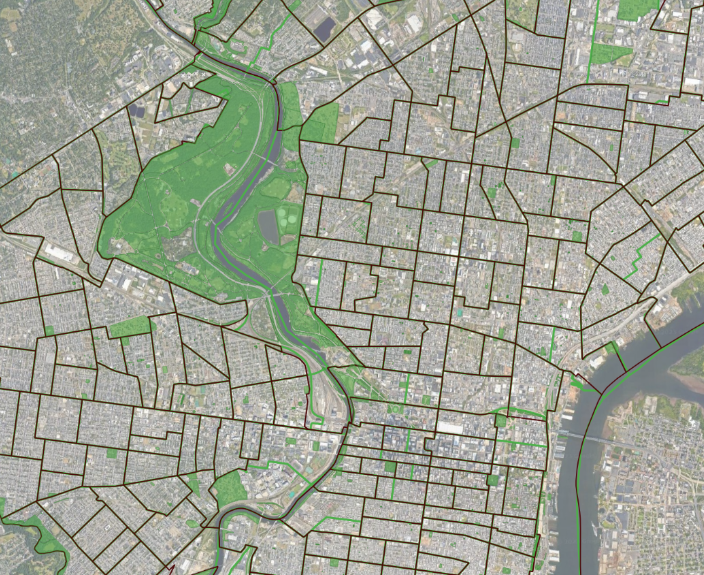
In my last blog post, I described my digital research project exploring causes of the global bee decline situation through the use of remote sensing using Landsat satellite imagery to analyze urban bee habitat conditions in the cities of Philadelphia and Montreal.
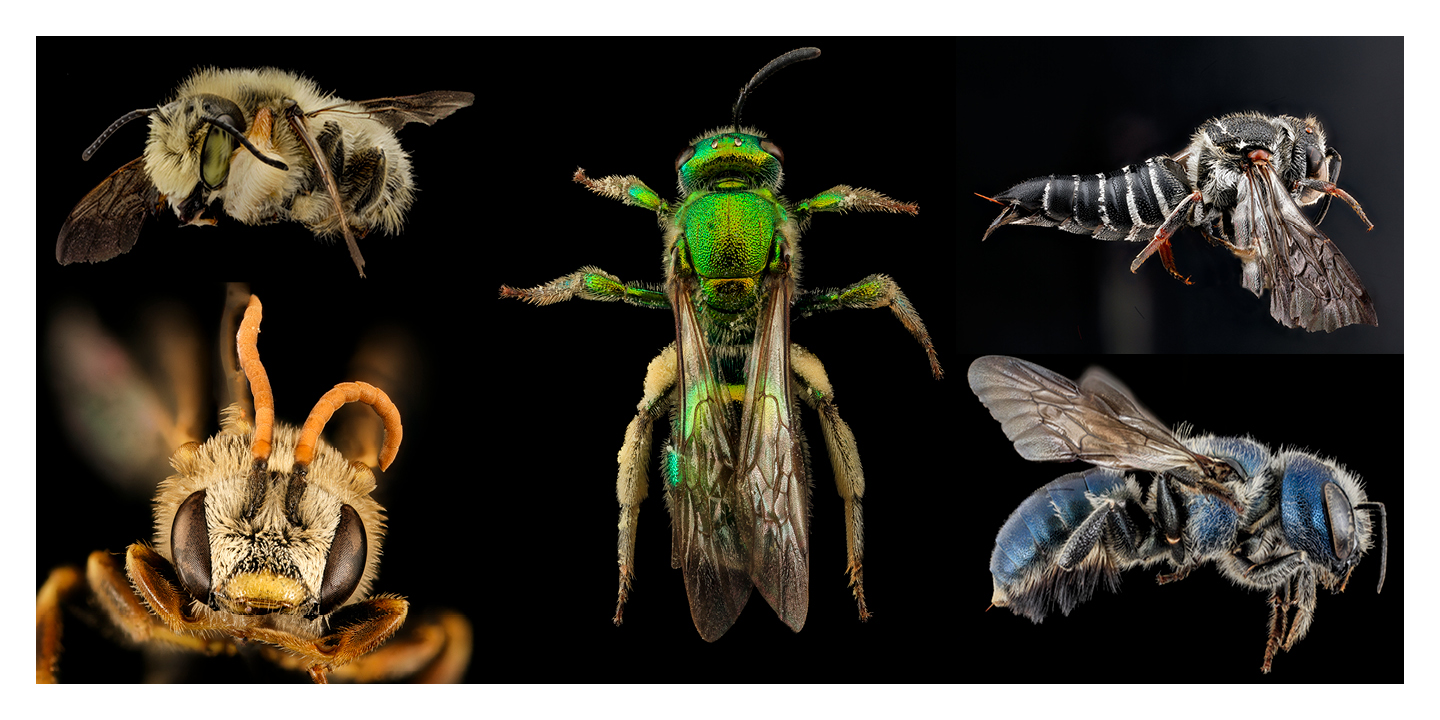
Globally, there are about 20,000 bee species, and about 2,000 of those are native to North America. Areas where bee populations have declined the most coincide with intensive agricultural practices, which involve crop monocultures with majorly low plant diversity and the heavy and frequent use of agrochemicals (Ollerton 2021, Koh et al. 2016). Emerging research has shown cities can be havens for bees because of their complex and heterogeneous landscapes and lack of intensive agriculture – an overall less toxic situation for bees (Baldock et al. 2015). What still needs to be done in this field is to better understand how different factors in the complex urban landscape affect bee diversity in cities.
My primary research question is How does the complex urban landscape affect bee diversity in Philadelphia? After using Landsat satellite imagery to quantify variations in urban land cover and correlations with variations in bee diversity, My research involves measuring bee diversity by sampling bees in various locations throughout the city of Philadelphia. To find adequately representative samples, I need to carefully choose the sampling locations, so they properly represent the spectrum of factors potentially influencing bee diversity levels across the urban landscape. This is where urban GIS, or geographic information systems, proves to be a useful tool.
Identifying City Areas to Sample Bee Populations
A given geographical area can be analyzed at different census levels – anywhere from the county at a larger level to the census tract or block group at a more fine level. I have chosen the census tract as my unit of analysis because its area, roughly the size of a neighborhood, encompasses enough space to make each of them likely to contain an appropriate level of green space in which I can sample bees later in my research process.
By selecting a collection of Philadelphia census tracts which have seen stagnant green space investment over the past decade, I aim to compare these tracts with a selection of census tracts which have seen the highest levels of investment. These two categories of comparison reflect the range of investment vs. disinvestment in urban green spaces.
Expressing this investment data in a spatially explicit way requires attaching it to shapefiles and then aggregating and sorting those shapefiles by census tract. To get the Philadelphia census tracts onto my GIS interface, I downloaded the Philadelphia census tract border shapefile from Open Data Philly. Next, to get the green space investment data into the census tracts, I downloaded a shapefile of the Pennsylvania Horticultural Society’s LandCare Program as well as a shapefile of all the vacant lots in the city. Each of these shapefiles contain the area of each parcel in their attribute table information, and I was then able to use the Summarize Within tool in ArcGIS to get area totals per census tract for both the LandCare parcels and vacant lots. With this aggregated information, I created an index of total LandCare area invested per vacant lot, which means the higher the index, the more green space investment in that census tract.
The attribute table in the GIS interface makes it easy to select groupings of features based on their data. I can sort the attribute table based on my newly-created green space investment index, see which five census tracts get highlighted at each extreme end of the index, and then zoom in to identify green spaces in each census tract where I might sample bees for my field work.
Findings on Vacant Spaces in Philly
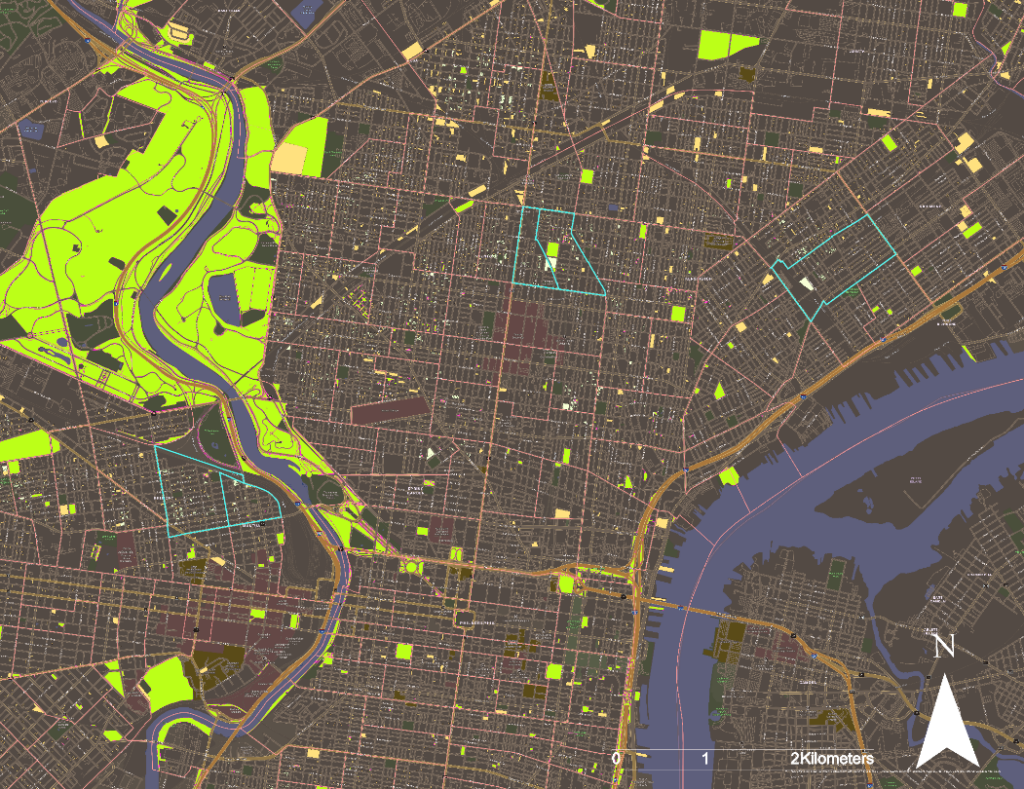
The five Philadelphia census tracts with the most LandCare area per vacant area exist in the Mantua section of West Philadelphia, North Philadelphia just north of Temple University’s Main Campus, and near Northeast Philadelphia. These are neighborhoods wherein the city and the Pennsylvania Horticultural Society have teamed up to provide the greatest levels of green space investment in terms of the index (Figure 1).
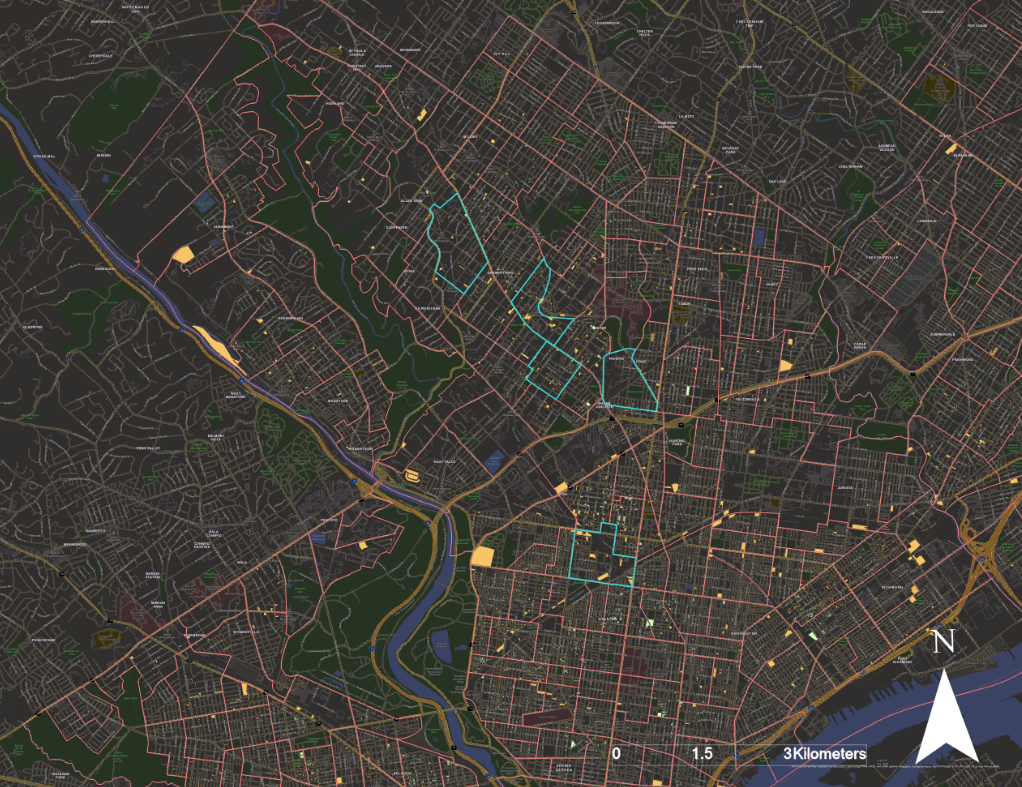
On the other side of the coin, the five Philadelphia census tracts with the least LandCare area per vacant area exist in the Nicetown and Germantown neighborhoods. These are areas where a small amount of green space investment has taken place, but there still exists larger proportions of vacant space (Figure 2).
Comparing my samples of bee diversity within these two extremes of my green space investment index will reveal insight into how city investment and urban land cover affect bee diversity levels in cities, a key bee conservation area.
Conclusions and Next Steps
Does urban green space investment have any real effect on urban ecosystems, particularly bee diversity? If cities can indeed be havens for bees, this is one of the key questions I want to answer in understanding these dynamics. GIS allows me to use publicly available census and land data to properly go about investigating these key urban ecological questions.
My bee sampling fieldwork will complete this analysis that spans urban ecology, political ecology, and GIS, providing information for future directions in urban sustainability policy. It is uncommon for approaches in political ecology to be paired with empirical urban ecology, and this research brings them together with remote sensing and GIS as key digital methods. This kind of transdisciplinary is absolutely necessary for tackling 21st century socio-ecological problems.
Works Cited
Baldock, Katherine C. R., Mark A. Goddard, Damien M. Hicks, William E. Kunin, Nadine Mitschunas, Lynne M. Osgathorpe, Simon G. Potts, et al. 2015. “Where Is the UK’s Pollinator Biodiversity? The Importance of Urban Areas for Flower-Visiting Insects.” Proceedings of the Royal Society B 282 (20142849). http://dx.doi.org/10.1098/rspb.2014.2849.
Koh, Insu, Eric V. Lonsdorf, Neal M. Williams, Claire Brittain, Rufus Isaacs, Jason Gibbs, and Taylor H. Ricketts. 2016. “Modeling the Status, Trends, and Impacts of Wild Bee Abundance in the United States.” PNAS 113 (1): 104–45.
Ollerton, Jeff. 2021. “Urban Environments.” In Pollinators & Pollination, 124–41. Exeter, UK: Pelagic Publishing.