By Austin Martin
Introduction: Bees Are Declining, but Cities Can Be Havens for Bees
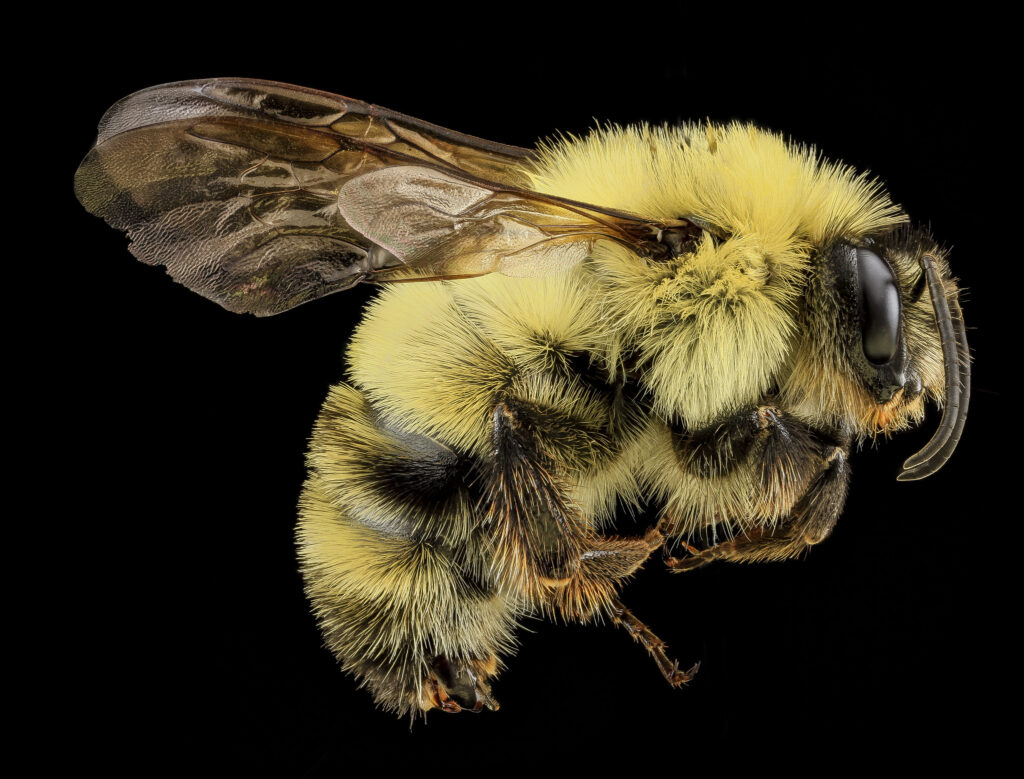
Cities and urbanization are generally thought to negatively impact biodiversity. At the same time, urbanization can also increase diversity for certain species because of the urban landscape’s heterogeneity (McKinney 2008). One such species group is bees. Research shows that because of urban green spaces, vacant lots, urban farms and gardens, green rooftops, and riverbanks, some bees do well in cities relative to non-city urban land uses (Hall et al. 2016).
The reasons for this stem from the lifestyles and habits of diverse bee species ranging from solitary-living ground-nesting “mining bees” of the Andrena genus to bumblebees (genus Bombus) who nest in small colonies. Patches of bare soil, vegetative brush, and dead wood are important for solitary nesters, and patches of diverse flowering plants with different blooming times throughout the year are crucial for the foraging habits of various bee species in search of nectar and pollen (Ollerton 2021a).

For my Scholars Studio fellowship, I am using digital mapping to assess the changing face of the city’s bee communities. Knowing that cities can be havens for bees proves important in our efforts to protect bee populations and create the conditions for their future thriving. Digital mapping has been under-utilized in this endeavor. Bees are one of the most important pollinator groups, but they have been in serious decline for decades due to factors ranging from intensive agricultural and lawn practices to habitat loss from urbanization (Ollerton 2021b). My goal is to understand land cover changes and impacts in urban bee havens as I contribute to this growing body of work.
In the past, I sampled bees throughout Metropolitan Detroit, MI and used GIS to find whether Census variables correlate with bee diversity. Going forward, I will pivot to remote sensing as the focus of my Scholars Studio contribution. A key variable to consider is the land cover influencing bee nesting and foraging. Remote sensing is the use of satellites, aircraft, or drones to acquire aerial photography of Earth’s land cover, which can then be digitally processed and analyzed with tools such as R programming. In my effort to understand urban land cover affects bees, I am using Landsat satellite imagery, and I will focus on Philadelphia, Pennsylvania.
What Kind of Remote Sensing Helps Us Understand Bees in Cities?
Using remote sensing in a complex urban area to study an insect’s habitat might look different than when using remote sensing to look at damaged crops or forest cover changes. A practitioner of remote sensing needs to consider the various study area dimensions that different satellites can capture. These include spatial resolution (the ground area covered by one pixel), temporal resolution (the amount of time between satellite photographs taken of an area), radiometric resolution (the range in greyscale contrast) and spectral resolution (the number of wavelength ranges captured by the imagery).
Spatial Resolution vs. Spectral Resolution: A Tradeoff
For me to accurately measure and classify land cover that affects bees, I need to consider the two key imagery dimensions of spatial resolution and spectral resolution. A high spatial resolution comprises of smaller pixels. This can more fully capture the fine details of the urban mosaic. Likewise, a high spectral resolution has more granular bands of the electromagnetic spectrum in its imagery. This makes it possible to venture beyond the visible wavelength spectrum into ultraviolet or infrared regions of the electromagnetic spectrum, allowing for otherwise unseen satellite image features. Useful image processing features such as atmospheric correction, cloud masking, and land cover classification are only possible with a high spectral resolution. I can also transform these bands to produce vegetation indices based on the amount of vegetation or greenness by utilizing one or two near infrared bands. This communicates meaningful biophysical information including photosynthesis and biomass levels.
Selecting the optimal combination of spatial and spectral resolution requires a tradeoff. Bee habitat exists on a fine scale and therefore calls for a high spatial resolution. However, most high-resolution satellite imagery is only available through commercial satellites (e.g. SPOT 5 and Kompsat03A) and does not feature the spectral resolution that allows vegetation index analysis, land classification, and other important image processing. The Landsat program is the longest-running satellite imagery program, and the Landsat 9 satellite is the most recent addition. Its imagery has a 30-meter resolution, meaning one pixel covers a 30m x 30m area. This spatial resolution is not high enough to visualize the minute details of the heterogenous urban mosaic. However, its high spectral resolution allows for precisely the kind of image processing necessary to identify bee-relevant vegetative dynamics.
Image Acquisition and Transformation
The open-source availability of Landsat imagery makes Landsat more accessible than typical commercial satellite data. The US Geological Survey’s website freely offers EarthExplorer (earthexplorer.usgs.gov), an online search, discovery, and ordering tool of remote sensing imagery. EarthExplorer’s interface allows one to select locations, time periods, satellite sources, and other criteria before downloading the imagery.
I find R Studio to be one of the most versatile software tools, and remote sensing image processing is just one of many of those possibilities. R Studio can be used to unpack the archived Landsat image file into its individual spectral bands, each its own raster image. From here, R commands can provide visual plots of the Landsat imagery. To get the image ready for land cover classification, it may need to be cropped, clouds may need to be masked, and bands should be transformed to bring out visual characteristics for vegetative analysis.
Tasseled Cap Transformation
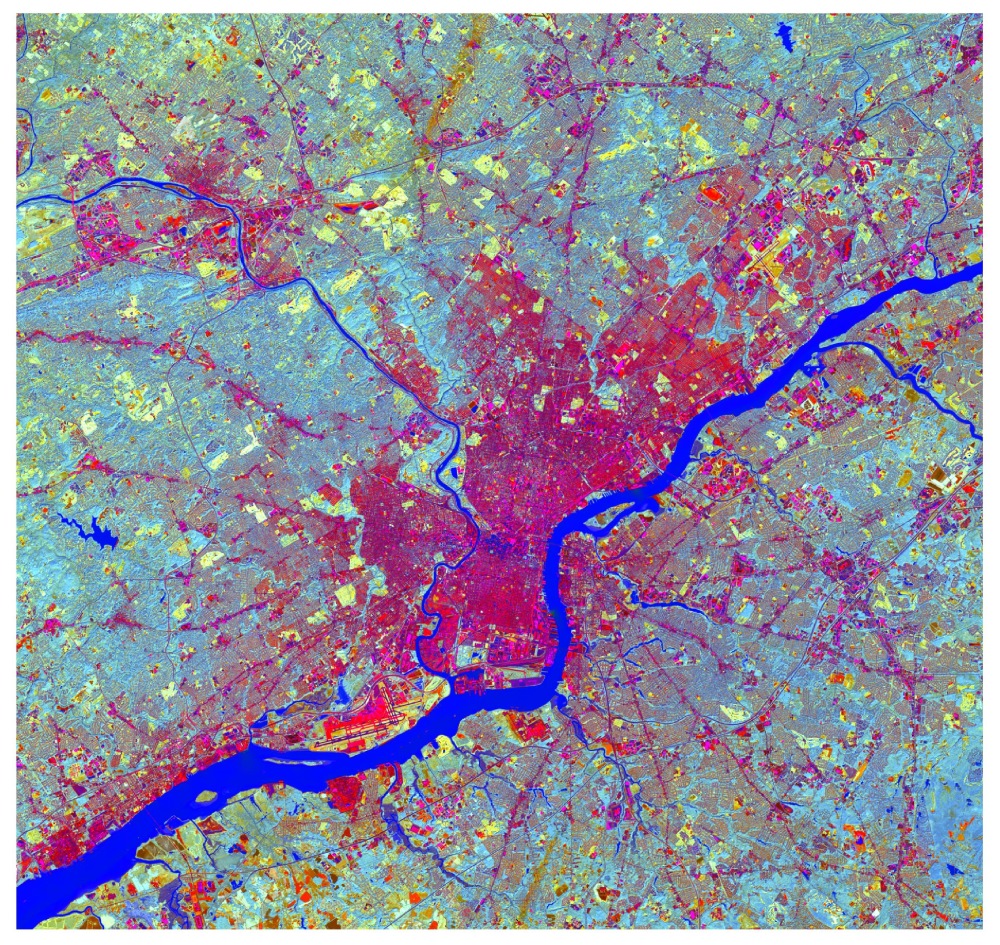
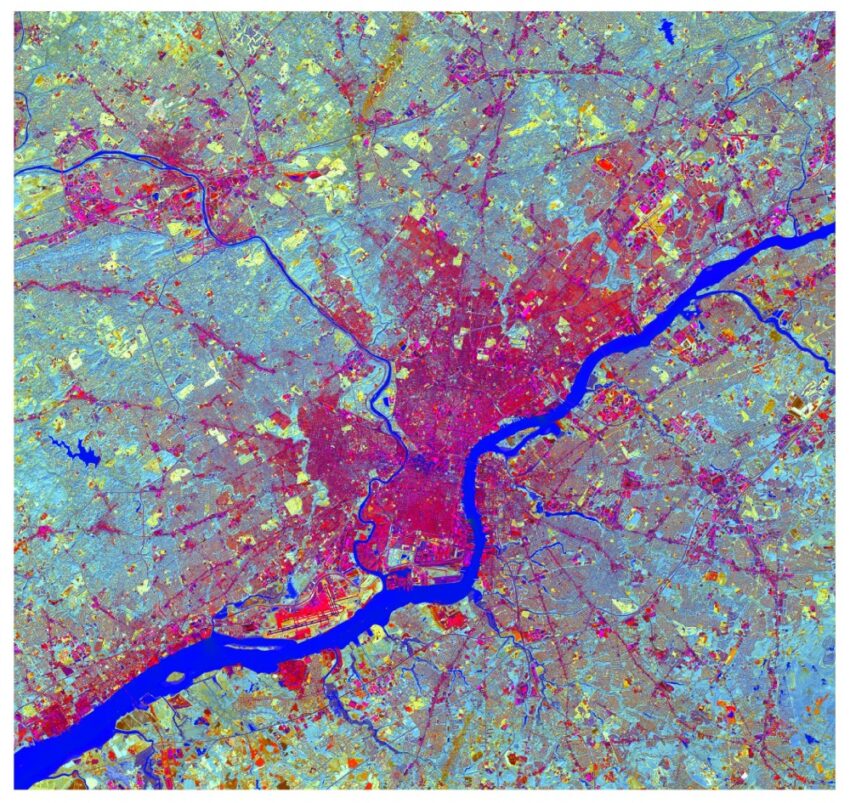
For the latter, there are two viable routes. Near Infrared and Red bands can be transformed to get the commonly used Normalized Difference Vegetation Index (NDVI), an expression of the ratio of the difference and sum between the two bands (Vrieling et al. 2013). Alternatively, the Kauth-Thomas Tasseled Cap Transformation can be used. This produces a four-band output that goes beyond the visual to emphasize soil brightness and vegetation among other features (Siew and Koch 2008). For the purposes of bee habitat analysis, the Tasseled Cap transformation is ideal because it simultaneously highlights vegetation and soil features, two land cover aspects with bearing on a variety of bee species’ nesting and foraging habits (Figure 1).

Where To Go Next
This spectrally transformed image of my study site leaves me with an aesthetically beautiful and high-utility springboard for my next steps in my analysis. Going forward, I will describe the process of transferring this image to QGIS where I will perform land cover classification for machine learning change analyses in R. Again, this medium-level spatial resolution is the limitation I have accepted in lieu of the soil and vegetation qualities made available with Landsat’s ideal spectral resolution. However, the ability to quantify changes and spatial patterns in Philadelphia’s vegetation and soil characteristics could provide key insights that will affect bee communities for the better or worse.
Works Cited
Hall, Damon M., Gerardo R. Camilo, Rebecca K. Tonietto, Jeff Ollerton, Karin Ahrné, Mike Arduser, John S. Ascher, et al. 2016. “The City as a Refuge for Insect Pollinators.” Conservation Biology 31 (1): 24–29.
McKinney, Michael L. 2008. “Effects of Urbanization on Species Richness: A Review of Plants and Animals.” Urban Ecosystems 11 (2): 161–76. https://doi.org/10.1007/s11252-007-0045-4.
Ollerton, Jeff. 2021a. “The Shifting Fates of Pollinators.” In Pollinators & Pollination, 159–77. Exeter, UK: Pelagic Publishing.
———. 2021b. “Urban Environments.” In Pollinators & Pollination, 124–41. Exeter, UK: Pelagic Publishing.
Siwe, Rene Ngamabou and Barbara Koch. 2008. “Change vector analysis to categorise land cover change processes using the tasselled cap as a biophysical indicator.” Environmental Monitoring and Assessment 145: 227-235.
Vrieling, Anton, Jan De Leewu, and Mohammed Y. Said. 2013. “Length of Growing Period over Africa: Variability and Trends from 30 Years of NDVI Time Series.” Remote Sensing 5(2): 982-1000. https://doi.org/10.3390/rs5020982.
