Skip to content

Loretta C. Duckworth Scholars Studio

⠀

Menu
  • Scholars Studio Blog
    • Digital Methods
      • coding
      • critical making
      • data visualization
      • digital pedagogy
      • immersive technology (AR/VR)
      • mapping
      • textual analysis
      • web scraping
    • Disciplinary Fields
      • Anthropology
      • Archaeology
      • Architecture
      • Art History
      • Business
      • Computer Science
      • Critical Digital Studies
      • Cultural Studies
      • Dance
      • Economics
      • Education
      • Environmental Studies
      • Film Studies
      • Gaming Studies
      • Geography
      • History
      • Information Science
      • Linguistics
      • Literary Studies
      • Marketing
      • Media and Communication Studies
      • Music Studies
      • Political Science
      • Psychology
      • Public Health
      • Sculpture
      • Sociology
      • Urban Studies
      • Visual Art
    • Cultural Analytics Practicum Blogposts
  • Current Staff
  • Newsletter
  • About
    • Games Group 
Menu

Visualizing Changes in Colombian Wetlands with ArcGIS Story Maps

Posted on March 21, 2022March 21, 2022 by Maria Victoria Sarmiento Giraldo

By Victoria Sarmiento

Story Mapping Land Cover Change

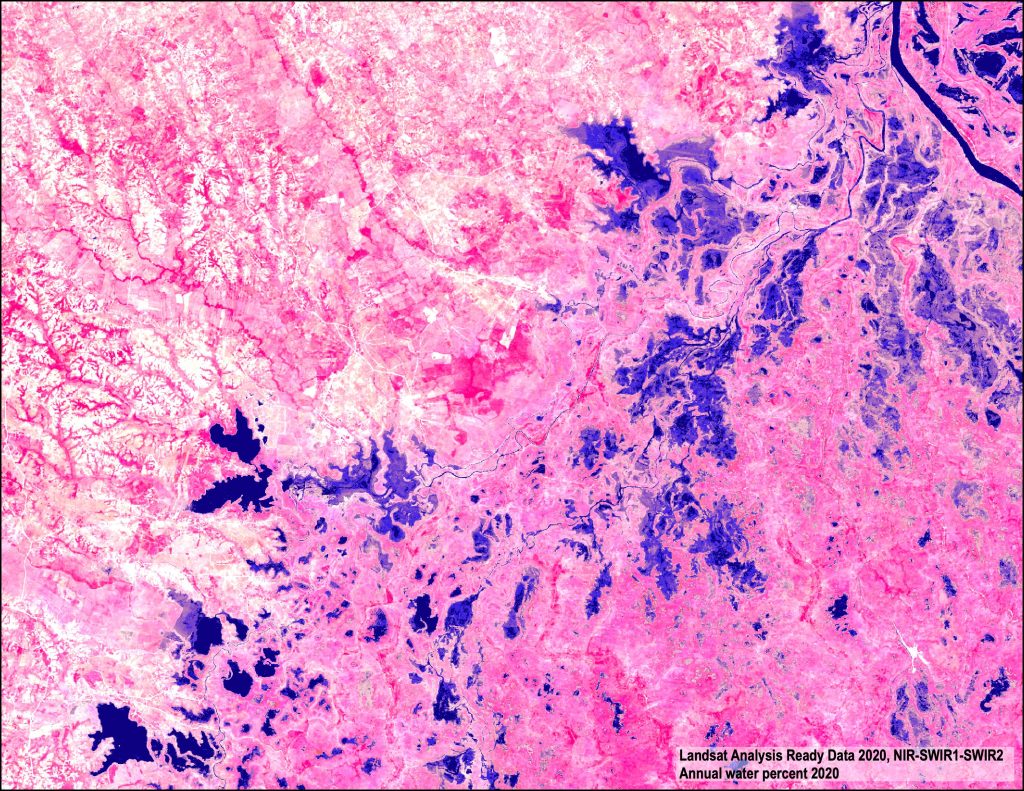
For the second part of my blog post for the Scholars Studio, I’ve created a ArcGIS Story Map as part of my project to produce a multitemporal land cover change analysis in the region of La Mojana in Colombia. StoryMaps allow me to provide a more immersive context for readers to explore my process of using GIS and remote sensing mapping techniques to understand how wetlands have been changing over time.

In my first post, I explained how I am using remote sensing techniques to map the wetlands in La Mojana. Here I am going to explain the importance of wetlands, and how I am studying changes in land covers in La Mojana.

Follow the link to the story map, Tracking Changes of Wetlands in Colombia:

Methodology

Data visualization and communication have become a crucial part of any research project. I came across ArcGIS Story Maps in the Scholars Studio. It is a tool that some of the fellows are using as part of their storytelling strategies. One of the main characteristics that caught my attention was the scrolling layout. It feels like you are scrolling through the New York Times online journal. Personally, the NY Times is my reference for data visualization and storytelling. That being said, I was impressed with the possibilities offered by ArcGIS Story Maps at first glance.

The making of the Story Map in a broader sense works as a fancy PowerPoint. The ArcGIS online app offers a set of predetermined designs that include fonts, combinations of colors, and backgrounds. The first step for creating the story map is deciding what the cover is going to look like. From there, you can add images, videos, text, and maps. What makes this tool appealing, is the way you can arrange the information. It is possible to create an interactive slideshow, timelines, map tours, and my favorite the sidecar, which integrates media with text to create a scrolling experience.

Another captivating feature is the swipe option, which allows the comparison of two maps or images with an interactive slider. This is very useful for a before and after visualization, for example. In relation to maps, this app is integrated with ArcGIS online, which is the platform where you can create web maps. There is also a feature for making express maps, that comes with default ESRI basemaps, allows drawings of points, lines, and areas, and you could include pop-ups and annotations. This feature is helpful for those not familiar with GIS software. It is simple and easy to use. No prior knowledge of GIS is required.

Although Story Maps provide an easy-to-use tool for storytelling, which is advantageous because it could be used by anyone, no matter their experience using GIS, it also has some constraints that need consideration. The first thing is, that you need a subscription to use ArcGIS and all its capabilities. Currently, the pricing for personal use is around $100 a year. For users that are part of a University, it is likely that you can have access through your institution as Temple does. A really good alternative to ArcGIS StoryMaps is Mapbox. It is free and it offers ready-to-use Templates for creating an interactive storytelling experience. Unlike ArcGIS online, Mapbox required a basic level of coding in HTML structure, CSS, and JavaScript.

More specifically, I found limitations in the functionality of ArcGIS StoryMaps when trying to upload my raster data to create maps. It is not possible to do that. Instead, I had to go around and upload an image of my raster to create the visuals for my story. In the end, I made it work, but I think that for users whose work is based on raster data, it could be problematic.

Conclusions

Wrapping up, I think StoryMaps is a great tool for visual communication. It offers an impressive scrolling storytelling experience, as good as the New York Times stories. It is easy and offers a variety of designs for presenting the information in an appealing way. No prior experience with GIS is needed, but it is licensed software, meaning that you need to pay a subscription to use it.


Recent Posts

  • The Untold History of Fletcher Street’s Stables April 21, 2025
  • Building an Immersive Archive of the Greek Orthodox Churches in Istanbul April 15, 2025
  • Tracing Influence in Genealogies of Communication Theory April 14, 2025

Tags

3D modeling 3D printing arduino augmented reality banned books coding corpus building critical making Cultural Heritage data cleaning data visualization Digital Preservation digital reconstruction digital scholarship film editing game design games gephi human subject research linked open data machine learning makerspace makerspace residency mapping network analysis oculus rift omeka OpenRefine Photogrammetry Python QGIS R SketchUp stylometry text analysis text mining textual analysis top news twitter video analysis virtual reality visual analysis voyant web scraping webscraping

Recent Posts

  • The Untold History of Fletcher Street’s Stables April 21, 2025
  • Building an Immersive Archive of the Greek Orthodox Churches in Istanbul April 15, 2025
  • Tracing Influence in Genealogies of Communication Theory April 14, 2025

Archives

Meta

  • Log in
  • Entries feed
  • Comments feed
  • WordPress.org

Archives

Blog Tags

3D modeling (11) 3D printing (14) arduino (8) augmented reality (5) banned books (3) coding (12) corpus building (4) critical making (7) Cultural Heritage (11) data cleaning (4) data visualization (11) Digital Preservation (3) digital reconstruction (9) digital scholarship (12) film editing (3) game design (3) games (6) gephi (3) human subject research (3) linked open data (4) machine learning (6) makerspace (8) makerspace residency (4) mapping (30) network analysis (17) oculus rift (8) omeka (3) OpenRefine (4) Photogrammetry (5) Python (8) QGIS (10) R (9) SketchUp (4) stylometry (8) text analysis (10) text mining (4) textual analysis (32) top news (102) twitter (5) video analysis (4) virtual reality (17) visual analysis (5) voyant (4) web scraping (16) webscraping (3)

Recent Posts

  • The Untold History of Fletcher Street’s Stables April 21, 2025
  • Building an Immersive Archive of the Greek Orthodox Churches in Istanbul April 15, 2025
  • Tracing Influence in Genealogies of Communication Theory April 14, 2025
  • From Theory to Practice: Weaving in Response to the Grid in the Global Context March 26, 2025
  • Visiting a Land of Twilight February 24, 2025

Archives

©2025 Loretta C. Duckworth Scholars Studio | Design: Newspaperly WordPress Theme
Menu
  • Scholars Studio Blog
    • Digital Methods
      • coding
      • critical making
      • data visualization
      • digital pedagogy
      • immersive technology (AR/VR)
      • mapping
      • textual analysis
      • web scraping
    • Disciplinary Fields
      • Anthropology
      • Archaeology
      • Architecture
      • Art History
      • Business
      • Computer Science
      • Critical Digital Studies
      • Cultural Studies
      • Dance
      • Economics
      • Education
      • Environmental Studies
      • Film Studies
      • Gaming Studies
      • Geography
      • History
      • Information Science
      • Linguistics
      • Literary Studies
      • Marketing
      • Media and Communication Studies
      • Music Studies
      • Political Science
      • Psychology
      • Public Health
      • Sculpture
      • Sociology
      • Urban Studies
      • Visual Art
    • Cultural Analytics Practicum Blogposts
  • Current Staff
  • Newsletter
  • About
    • Games Group