By Laurie Fitzpatrick
Introduction
In my previous blog post, Digital New Sweden, Part 1: Creating a Database of New Sweden Colonizers, I discussed how I combined data from newly digitized primary sources with existing information from the work of Drs. Amandus Johnson and Peter Stebbins Craig.[1] I am creating this database to support my research into the New Sweden colony in early modern North America that existed from 1638 until 1654 along both sides of the Delaware from present day Wilmington to the falls at Trenton. In this blog post, I present Gephi visualizations of this data to demonstrate the viability of my database.
I chose Gephi for its ability to visualize connections between individuals (actors) and ‘map’ their organization as communication networks and cliques. In selecting information to build my database, I estimate its utility through network analysis that quantifies “actors who are the most important or the most prominent … [who are] located in strategic locations within the network.” [2] My database and visualization project will combine the work of Johnson and Craig with raw data from primary sources to discover connections between colonizers that might explain developments and tensions in this colony.
Data Visualized with Gephi: Betweenness Centrality versus Modularity Groups
To work with Gephi, I prepared ‘Nodes’ lists and ‘Edges’ lists in Excel according to data formatting requirements.
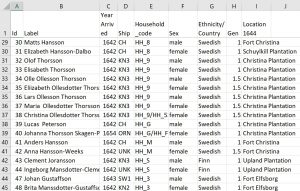
In my Gephi “Nodes” lists, I named the families and leaders on the colony from 1640 through 1644. I omitted soldiers and children born later in the colony to focus on these first families who were shipped over when the Swedish government and New Sweden Company accelerated their effort to grow the colony (Figure 1). Although some soldiers interacted with Swedish families, many were transient and departed the colony. The children omitted were born to colonizers after 1644 and represent second and third generations of colonizers. Both groups, although important for future research and visualizations, complicate and thus muddle the focused purpose of these first Gephi visualizations.
My Gephi “Edges” lists connected colonizers in these 4 ways to represent communication opportunities (people getting to know one another) between these people:
- Families as of 1644 Census of colonizers, spouses (generation 1) and children (generation 1.5).
- Ships in which they traveled to the New Sweden Colony (4-month sea journey).
- Locations (plantations and forts) where colonizers labored for the colony. [3]
- Colony officials with whom colonizers interacted (governors, commissaries).
Nodes List with Identified Connections

Figure 1: Three connections shown in this nodes list are family connection (Household_code), the ships on which they travelled to the colony (3 to 4-month sea journey under treacherous, close, and primitive conditions), and work locations in 1644 after their arrival. Connections with colony leadership were made in the Gephi Edges list.
Measuring Betweenness Centrality
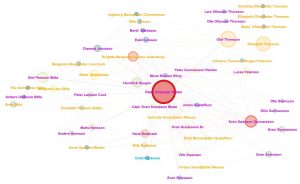
Following a YouTube Gephi tutorial titled “Updated Gephi Quick Start Tutorial for v 0.9,” by Dr. Jennifer Golbeck, I conducted a ‘betweeness centrality’ analysis of my data to discover the ‘importance’ of actors by connecting them by means of their opportunity to know and work with one another (Figure 2).
Swedish State Actors and New Sweden Families, 1642-1644

Figure 2: A normative image of state power in New Sweden. The names of women are in dark yellow and the names of men are in purple.
As stated by Wasserman and Faust, “Prominent actors are those that are extensively involved in relationships with other actors … [which] makes them more visible to the others.” [4] Visualizing betweeness centrality created an image of a conventional power structure represented by the prominence of the main New Sweden state actor, Governor Peter Hollander Ridder, as the largest red node in the center of this visualization. The size of this node, as well as it’s hot (red) color indicates Ridder’s prominence by virtue of his ability to communicate with other actors. This image reflects the idea of a Swedish state power actor administering and building a colony, and it does not reflect the status of individual colonizers as they worked alongside Swedish officials and not for them, to recreate the Swedish state in New Sweden. For this reason, a betweeness centrality visualization of New Sweden colonizers shows ‘wished for’ top-down power structure, as opposed to actual power sharing within the colony.
Modularity Group Analysis
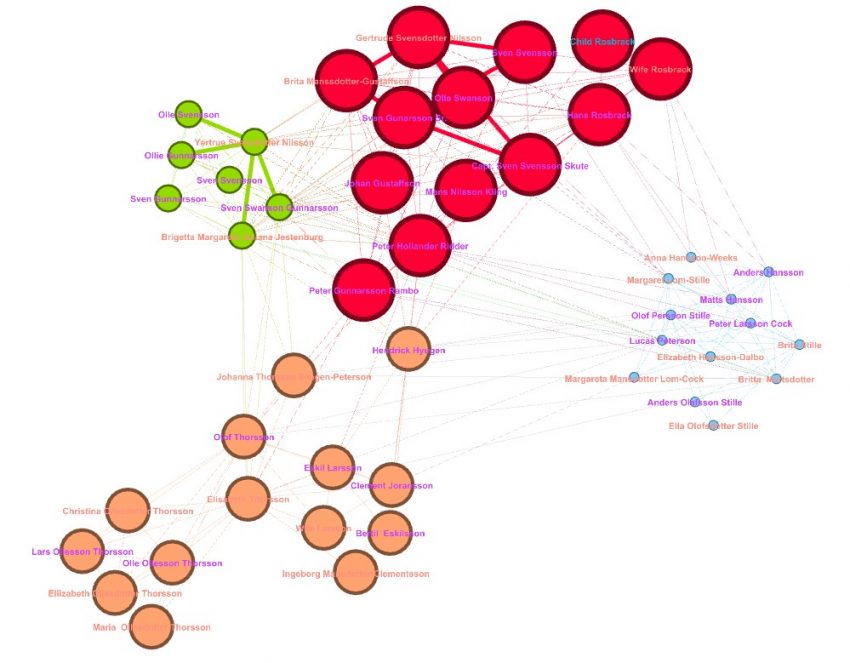
In performing a ‘modularity group’ analysis, Gephi revealed sets of interconnected cliques or cohesive subgroups which “are subsets of actors among whom there are relatively strong, direct, intense, frequent or positive ties.”[5] Prestige among 17th century Swedish and Finnish farmers in a village can be understood by how well individuals supported the collective.[6] I suggest that prestige in New Sweden can be measured by one’s ability to support others in the colony, and this success is an indicator of an individual’s agency. Visualizing cliques among the first New Sweden families offers an image of agency that reveals the independence of colonizers from Swedish state actors.
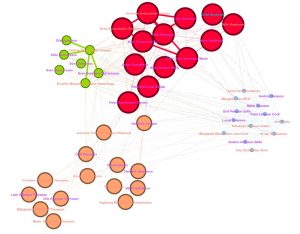
The modularity group visualization in Figure 3 breaks away from the normative view of centralized, male dominated state power depicted in Figure 2, to instead glimpse how New Sweden colonizers relied on each other more than on leadership for their survival. This analysis demonstrates the potential for measuring a colonizer’s status in New Sweden, as shown by how well they supported others in the colony.
Modularity Groups of New Sweden Colonizers

Figure 3: Cliques of prominent actors in New Sweden now includes state actors and colonizers. Size and color indicate prominence (Red, large = most prominent and Blue, smallest = least prominent).
This visualization might also explain increased tensions in the colony that began with the introduction of independent families, as opposed to obedient soldiers and officers, into the population if this colony. Visualizing modularity groups can reveal sources of tension between colonizers and the Swedish state as it manifested then faded in New Sweden. At this early stage in my research, I propose that colonizers worked communally to support the Swedish state building effort in New Sweden for their mutual benefit. They resisted the wealth extraction attempted by Swedish state power actors, while creating their own right to engage in the same extraction activity with local Lenape and Susquehannock. Within one generation, the wealth extraction of Swedish colonizers grew to include stealing the labor of enslaved Africans whom they bought from the Dutch and then from the English.
Future Explorations
I reached my main goal for this stage of my project, which was to explore the possibility that my new database has value that can also be visualized in novel and compelling ways. For future work, my data will be broadened to include information about:
- All colonizers who entered, left, or stayed in this colony.
- Women’s’ economic contributions to the colony.
- Trade with local Lenape and Susquehannock.
- Purchasing and selling local land.
- What Lutheran churches (priests and congregants) changed communication between colonizers and influenced the politics and economics of their society.
I will use traditional methodologies for crafting historical arguments, and use Gephi to explore possibilities for new investigations, and also illustrate new arguments arising from my data. I can, for example, use Gephi to visualize the development of cliques over time to see if these groups formed local Swedish community leadership as recorded in primary sources. After the Dutch took the colony in 1655, Swedish state actors returned to Europe and were replaced by local Swedes elected from the community to sit on the newly created Upland Court. These new leaders adjudicated local disputes among colonizers. I am also interested in seeing if local cliques influenced the establishment of slavery among the second and third generation of Swedes along the Delaware, starting in the late 17th century.
Gephi is a valuable tool for breaking me out of 2-D facts and figures based statistical analysis I have done using Excel. The interpretive power of Gephi enables third (location within a network) and fourth (change over time) dimensional types of analysis.
Please feel free to contact me with questions or comments about this work at fitzpatl@temple.edu
References
Gephi – Clustering layout by modularity. (https://parklize.blogspot.com/2014/12/gephi-clustering-layout-by-modularity.html), accessed 11/15/21.
Golbeck, Jennifer. “Updated Gephi Quick Start Tutorial for v 0.9,” https://www.youtube.com/watch?v=371n3Ye9vVo
Toivo, Raisa Maria. Witchcraft and Gender in Early Modern Society, Finland and the Wider European Experience. (Routledge: Ashgate Publishing Ltd, Hampshire, England and Burlington, VT, 2008).
Wasserman, Stanley and Faust, Katherine. Social network analysis: Methods and applications (Cambridge University press, Cambridge, England, 1994).
Notes
[1] Dr. Amandus Johnson wrote an influential 2 volume work, The Swedish Settlements on the Delaware, 1638 – 1654 published in 1911, and genealogist Dr. Peter Stebbins Craig contributed over 20 years of genealogical work about individual 17th and 18th century New Sweden colonizers. Johnson focused on prestige individuals and mentioned individual colonizers who supported these ‘historic and important’ men, and Craig focused on reporting information for every man, woman and child he could verify.
[2] Stanley Wasserman and Katherine Faust. Social network analysis: Methods and applications (Cambridge University press, Cambridge, England, 1994), p. 169.
[3] Raisa Maria Toivo. Witchcraft and Gender in Early Modern Society, Finland and the Wider European Experience. (Routledge: Ashgate Publishing Ltd, Hampshire, England and Burlington, VT, 2008), p. 125. According to Tovio, among 17th century Finnish farmers, “one person’s ability to carry out his or her duties was dependent in the way others carried out theirs” … and this interdependency extended to “the use of forests, of some common grazing land and part of fishing rights …”.
[4] Wasserman and Faust, p. 173.
[5] Ibid, p. 249.
[6] “Farming also included many responsibilities outside the directly agricultural sphere … [including] the responsibilities farmers had in the communal life of the village.” Tovio, p. 33.
