By Victoria Sarmiento
Introduction
As a graduate extern in the Scholar Studio, I am working to produce a multitemporal land cover change analysis in the region of La Mojana in Colombia. This blog post will introduce how I use remote sensing, where my data comes from, and how I plan to use it to achieve my research goals.
My research involves the use of satellite images to explore the transformation of landscapes. My goal is to understand how vital ecosystems, such as wetlands, have been transformed over time, and how the local social conditions have changed in relation to these transformations. During my career, I have been interested in understanding the dynamics of natural and social systems and how to apply scientific knowledge into decision-making, especially regarding biodiversity use and sustainability. My work is heavily influenced by the natural sciences, but I want to have a better understanding of the social process. That is why I am currently pursuing a Ph.D. in Geography and Urban Studies. Geography is an exciting field, interdisciplinary by nature, that connects the social and natural sciences to give a deep and broader perspective of our world.
Studying the Transformation of Landscapes

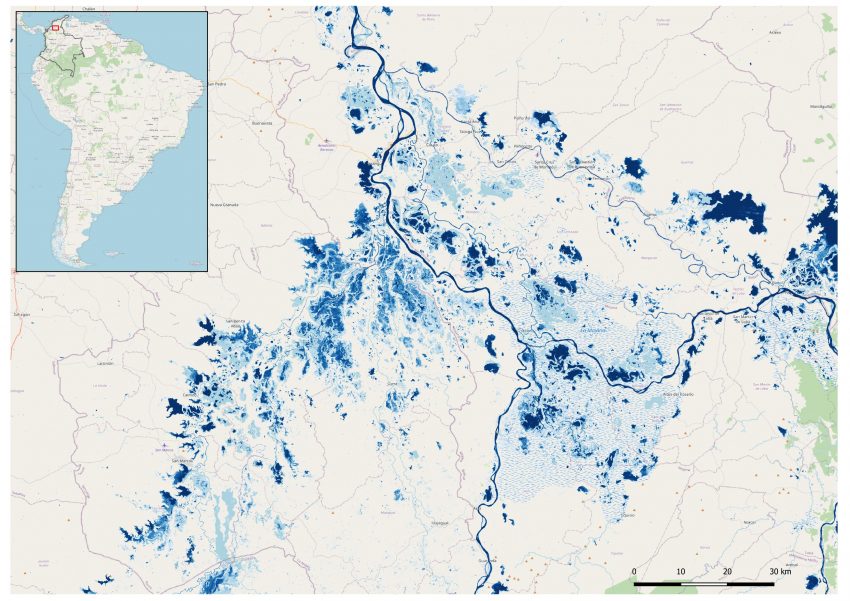
My research project focuses on the Caribbean region in Colombia, in an area locally known as La Mojana. La Mojana is a landscape composed of a network of wetlands, marshes, and forests, forming a floodplain that buffers the floods from the Magdalena, Cauca, and San Jorge rivers. It is a dynamic region in terms of the hydrological cycle, and it remains flooded for seven months from April to November (Aguilera 2004).
The area has been inhabited for over 2000 years, and its dwellers have developed strategies to cope and flourish in harmony with the flooding dynamics. Before the Spanish colonization, the Zenú culture, based on their sophisticated knowledge about the soils, the weather, and hydrologic dynamics of the area, developed a complex network of canals and terraces to manage the floodings and to cultivate their food, like corn, yucca, tubers, chilis, and fruits (Camacho 2015). Today, the intricate network of canals built by the Zenú culture can be seen in satellite images. They represent an important archaeological and cultural heritage for Colombia and the Caribbean region.
Despite the richness and ecological complexity, La Mojana is one of the poorest regions of the Colombian Caribbean, with high levels of basic needs, poverty, and unemployment. Since 2000, La Mojana has experienced a dramatic increase in the severity of the floods due to the alteration of the rain and drought cycles, increasing the average duration of the dry and rainy periods higher than historical records. In 2009-2010, heavy floods caused by the La Niña phenomenon left many people affected, losing their homes and crops. In the context of climate change, the consequences of the above-mentioned rainy wave could be an example of future extreme climate events. Considering the precariousness in which their communities live, the impacts of climate change could exacerbate the problems of this region.
Mapping the Wetlands with Remote Sensing
To study the transformations that the region has experienced, I am mapping the wetland and its surroundings over several years, using remote sensing. Remote sensing is an evolving field that seeks to acquire information about the Earth’s surface without being in contact with it. Satellites transport cameras (scanners, lasers, and linear arrays) that register pictures of the Earth. Those cameras have sensors used to measure and record the light emitted by objects on the Earth in a wide range of regions of the electromagnetic spectrum (e.g., ultraviolet, visible, infrared, and microwave).
The process of mapping land cover starts with the processing of satellite images. In my case, I am using Landsat images. Landsat is a program managed by NASA and the USGS; It offers the “longest continuous global record of the Earth’s surface” (NASA) since the early ’70s. Just a few days ago, on September 27, the newest satellite of the program, Landsat 9, was launched, ensuring the continuity of the program in the future. This large and continuous record of the Earth’s surface makes Landsat so powerful and valuable for analysis over long periods.
Accessing and Pre-processing Landsat Data
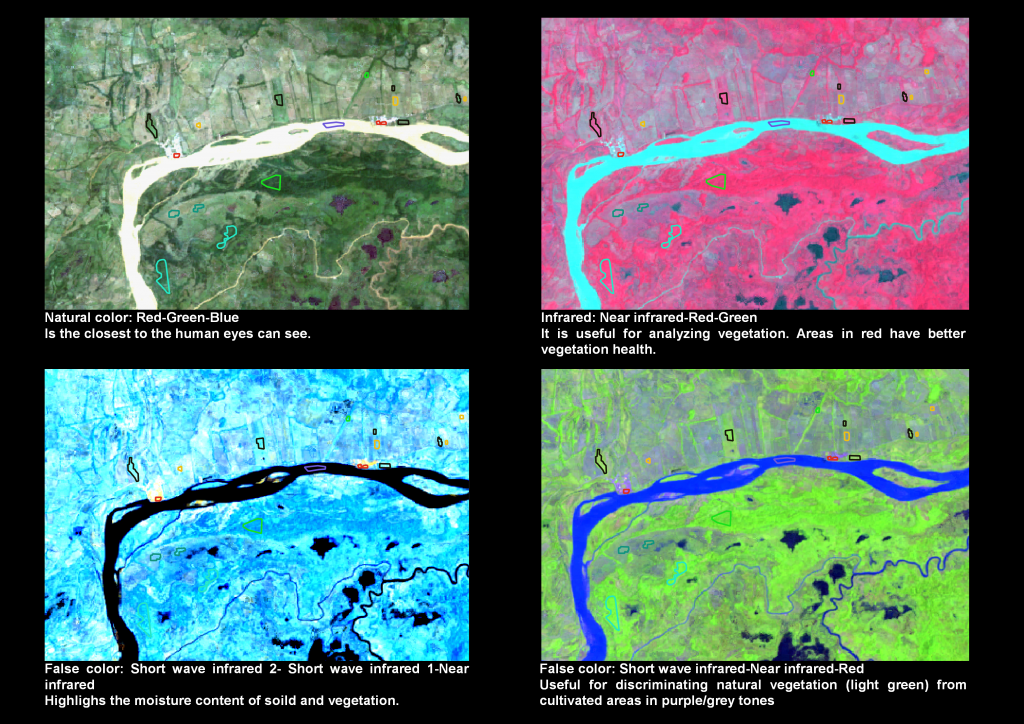
Currently, the Landsat archive is free and available through the USGS websites; however, this has not always been the case. The USGS made the Landsat imagery available until 2009, boosting remote sensing science and research related to characterizing and monitoring agriculture and environmental change. One feature that distinguishes Landsat satellites is the multispectral scanner system. The images captured by the satellite are composed of several bands. Each band captures the light in a specific region of the electromagnetic spectrum, such as blue, green, red, near-infrared, and shortwave infrared. The format of each image is known as a multiband raster. A raster consists of a matrix of cells, known as pixels, organized into rows and columns where each pixel contains a value.
When you download a Landsat satellite image, the values on the raster have no units, which means that those values do not represent the spectral response of the objects and surfaces of the Earth. Those values are referred to as digital numbers (DN). To prepare the image to be analyzed, I went through converting those DN into absolute reflectance units. You can think about reflectance as the interaction between the sunlight and the objects on the Earth that reflect the light, in other words, that “bounces off” the light back to the sky. Several physical phenomena influence this interaction, from the physical and chemical structure of the materials in the Earth to the atmospheric conditions when the sensor captures the picture. The workflow of transforming data from DN to reflectance is a process known as ‘atmospheric correction.’ I conduct this data transformation process using the R programming language with specialized libraries like “RStoolbox”, and “raster,” which were developed to handle satellite images and raster data.
The Challenges of Working with Satellite Images
In the initial stages of my project, I began processing two single-date, Landsat 8 images for 2020 and another 2 for 2010. At this stage, I faced one of the challenging issues when working with satellite images: the availability of good-quality images. Clouds are the main problem when working with satellite images. For my study area, the availability of cloud-free images is limited, and the issue worsens further back in time. In many cases, I found images with 70% cloud coverage, which makes it impossible to work with; even performing an atmospheric correction, it is tough to eliminate the cloud’s effect.
Very recently, the University of Maryland’s Global Land Analysis and Discovery Team (GLAD) developed a global dataset of Landsat Analysis Ready Data (ARD). The new dataset offers ready-to-use Landsat products for land cover mapping and change detection. They provide consistent images with minimal atmospheric contamination. This is an excellent contribution to the remote sensing field because the pre-processing (converting DN into reflectance) of each image is time-consuming and requires powerful computers; instead, researchers can now focus on actually analyzing the information.
Mapping Land Cover Change
Using the ARD tool, which is a free program that runs through the console on windows OS, I obtained four composites for the years 2000, 2010, 2009, 2011, 2020. Each composited was created, selecting the best pixels (no clouds) available throughout an entire year. That is why we call it a composite because it is the merging of pixels from different images.
In the last weeks, I have been focusing on preparing training polygons, which are the input data to run a classification model and produce a land cover map. This task consists on the visual interpretation of the composites where I have to identify the classes that will compose the map and manually, draw a lot of polygons for each class. I use QGIS for this purpose. QGIS is an open-source and free Geographic Information System, where you can analyze and visualize spatial information. QGIS also offers the possibility of arranging several map views on one screen. This feature is vital because it allows different band combinations of the same image or composite set in place simultaneously. This is crucial because each band combination highlights different elements of the scene. Once the training polygons are completed, the next step is to run a classification algorithm. I will give more details and explanations about it in my next post.
Any questions or comments, please contact me at victoria.sarmiento@temple.edu
References
Aguilera Díaz, M. (2004). La Mojana: riqueza natural y potencial económico (Documentos de Trabajo Sobre Economía Regional, Issue 48). http://www.banrep.gov.co/es/contenidos/publicacion/mojana-riqueza-natural-y-potencial-econ-mico
Camacho, J. (2015). Paisaje y patrimonio en la Mojana, Caribe colombiano. Geografía Ensino & Pesquisa, 19, 90–100. https://doi.org/10.5902/2236499419378
USGS. (Oct 2021). Earth Explorer. https://earthexplorer.usgs.gov/
NASA. (Oct 2021). Landsat Science. https://landsat.gsfc.nasa.gov/data/where-get-data
Pickens, A.H., Hansen, M.C., Hancher, M., Stehman, S.V., Tyukavina, A., Potapov, P., Marroquin, B., Sherani, Z., 2020. Mapping and sampling to characterize global inland water dynamics from 1999 to 2018 with full Landsat time-series. Remote Sensing of Environment 243, 111792. https://doi.org/10.1016/j.rse.2020.111792
Potapov, P., Hansen, M.C., Kommareddy, I., Kommareddy, A., Turubanova, S., Pickens, A., Adusei, B., Tyukavina A., and Ying, Q., 2020. Landsat analysis ready data for global land cover and land cover change mapping. Remote Sens. 2020, 12, 426; doi:10.3390/rs12030426 https://www.mdpi.com/2072-4292/12/3/426