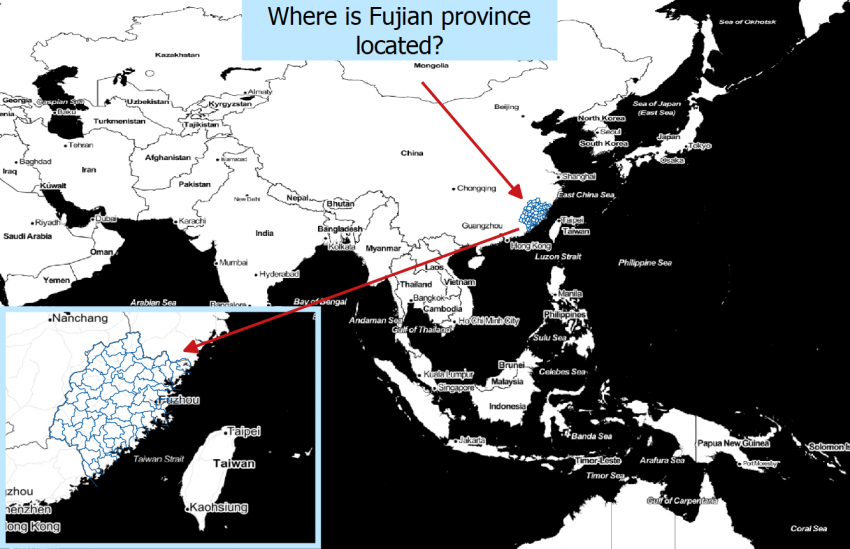
By Rouying Tang
I will introduce my digital project in this blog post. This project maps the trends related to temples constructed in Fujian, a Southeastern province in China. It ranges from the Jin 晉 (266-420CE) to the period of the Republic of China 中華民國 (1912-1949CE). I researched a suitable database, wrote, and ran Python codes to filter the data I needed. Then I also cleaned the data deeper through Excel, mapped the points through ArcGIS, and used Premiere to animate the maps I made. I also digitized the counties in Fujian in the Yuan 元 (1271-1368CE), Ming 明 (1368-1644CE), and Qing 清 (1636-1911CE). I will do more research to find out what factors influence the spatial-temporal pattern of temples constructed in Fujian. I am currently working on another project to study how the elevation factors affect the geographical distributions of temples in Fujian.
Why did I work on this project?
I initiated this project as part of the practicum work for Temple University’s Certificate in Cultural Analytics. I am honored to be the first graduate student at Temple University to achieve this certificate. This project also contributes to my doctoral dissertation, which will be focusing on the Buddhist history of Fujian.
An open content project, the “Buddhist Studies Authority Database Project” contains more than sixty thousand entries of place authority data. The entry for a place includes its names, location coordinates (this is vital for my project), districts, notes (related information including the reference), and category (critical for filtering out temple data). The place names and coordinates are designated serious ID numbers, which is convenient for future editing. The data is distributed as XML/TEI files to the public.

Their information is suitable for showing the distribution of temples in Fujian. There is little prior research on both the history and geography of Chinese Buddhism simultaneously. The only book that analyzes the temples constructed in Fujian is Fujianfojiaoshi 福建佛教史, which only lists temple names in tables. Therefore, I wanted to map the temples in Fujian to illustrate the geographical development of Buddhism in this region over a long historical period.
How did I work on this project?
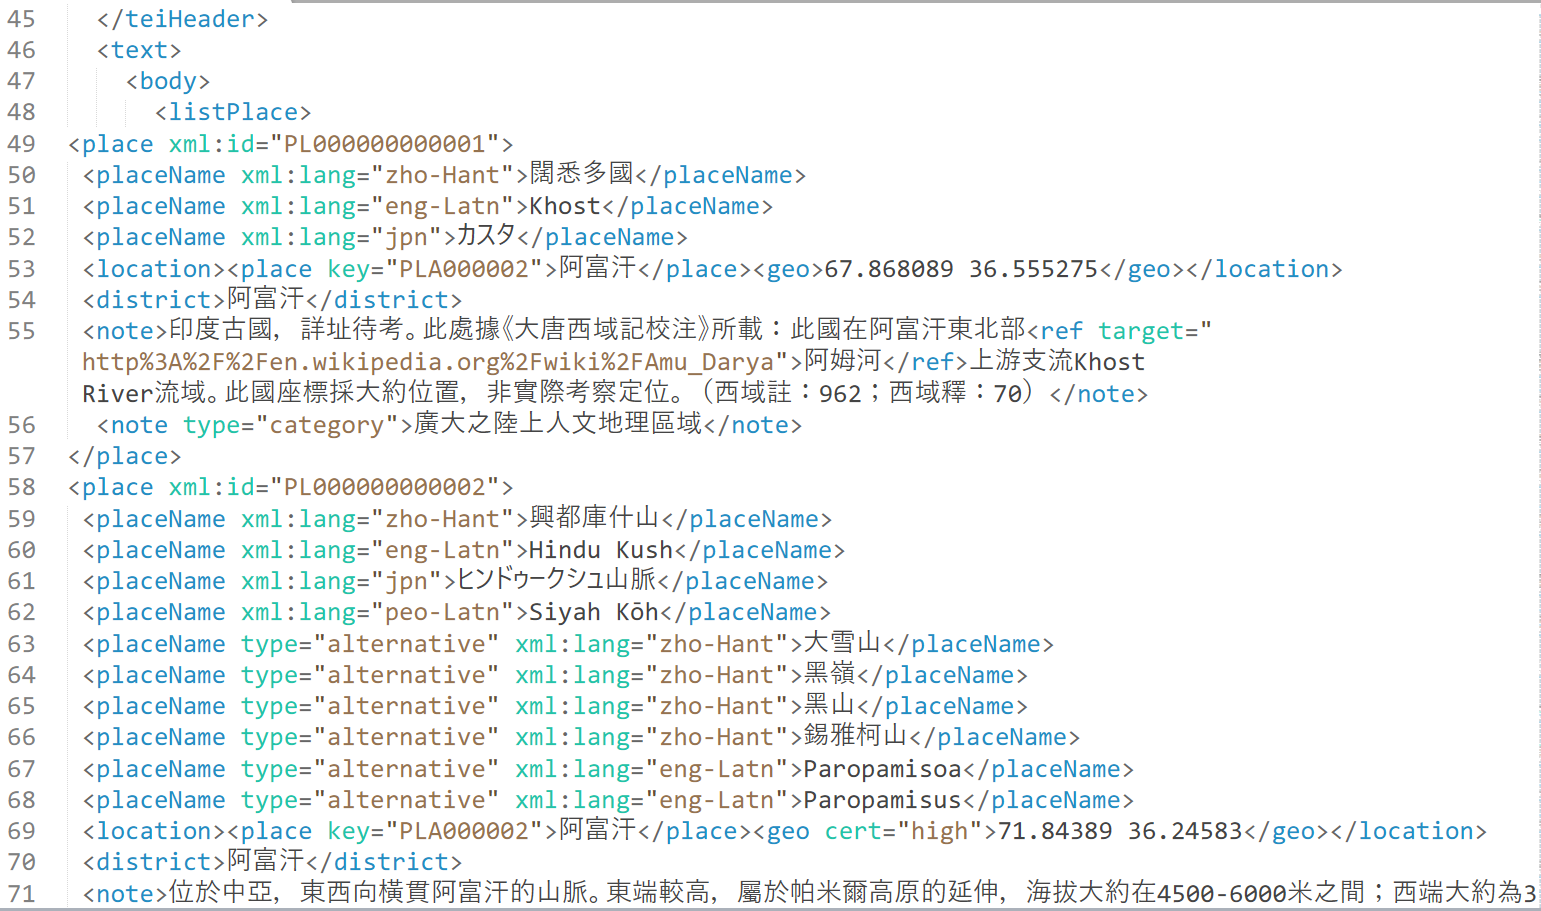
I downloaded the data from the database. Here is a sample of partial XML codes.
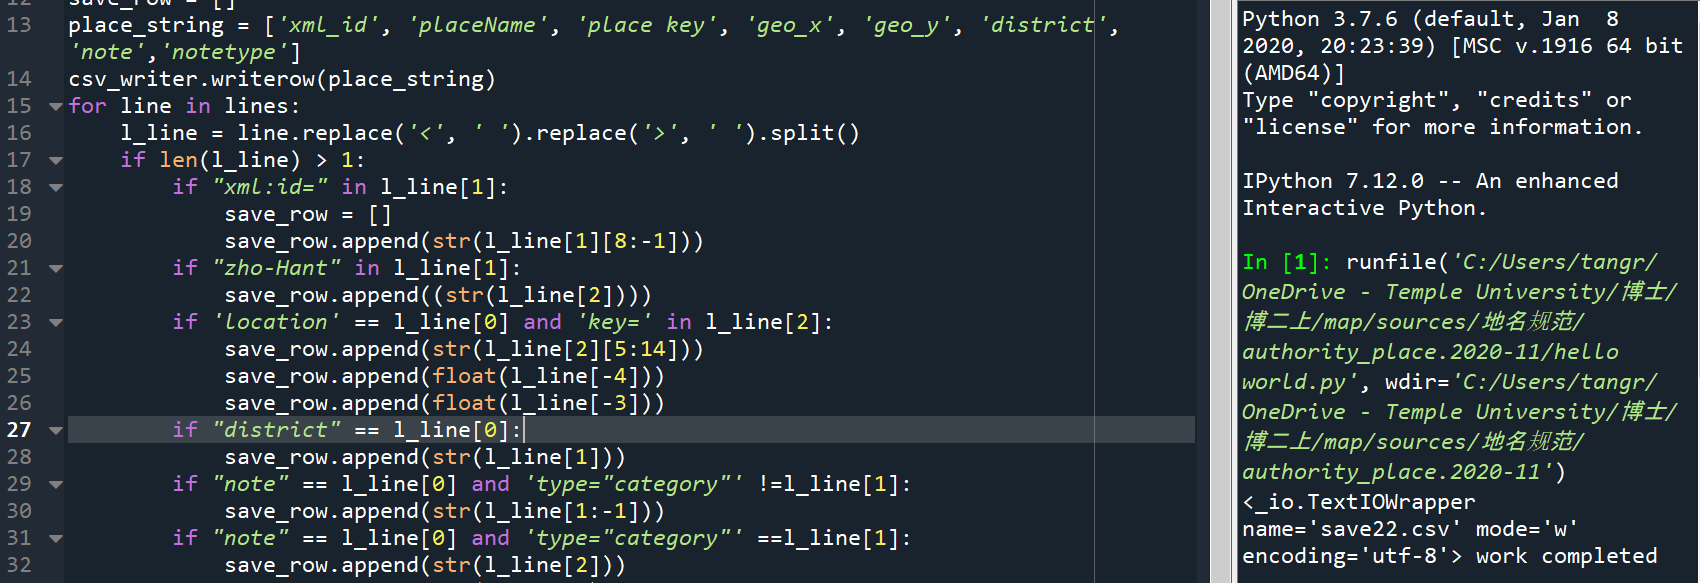
I wrote and ran a Python script to clean the data in Excel, then exported it as a CSV file. This CSV file contained all the temple data in Fujian (mainly Buddhist temples and a few Daoist temples) in Fujian’s district. Here is a picture of practical python scripts.
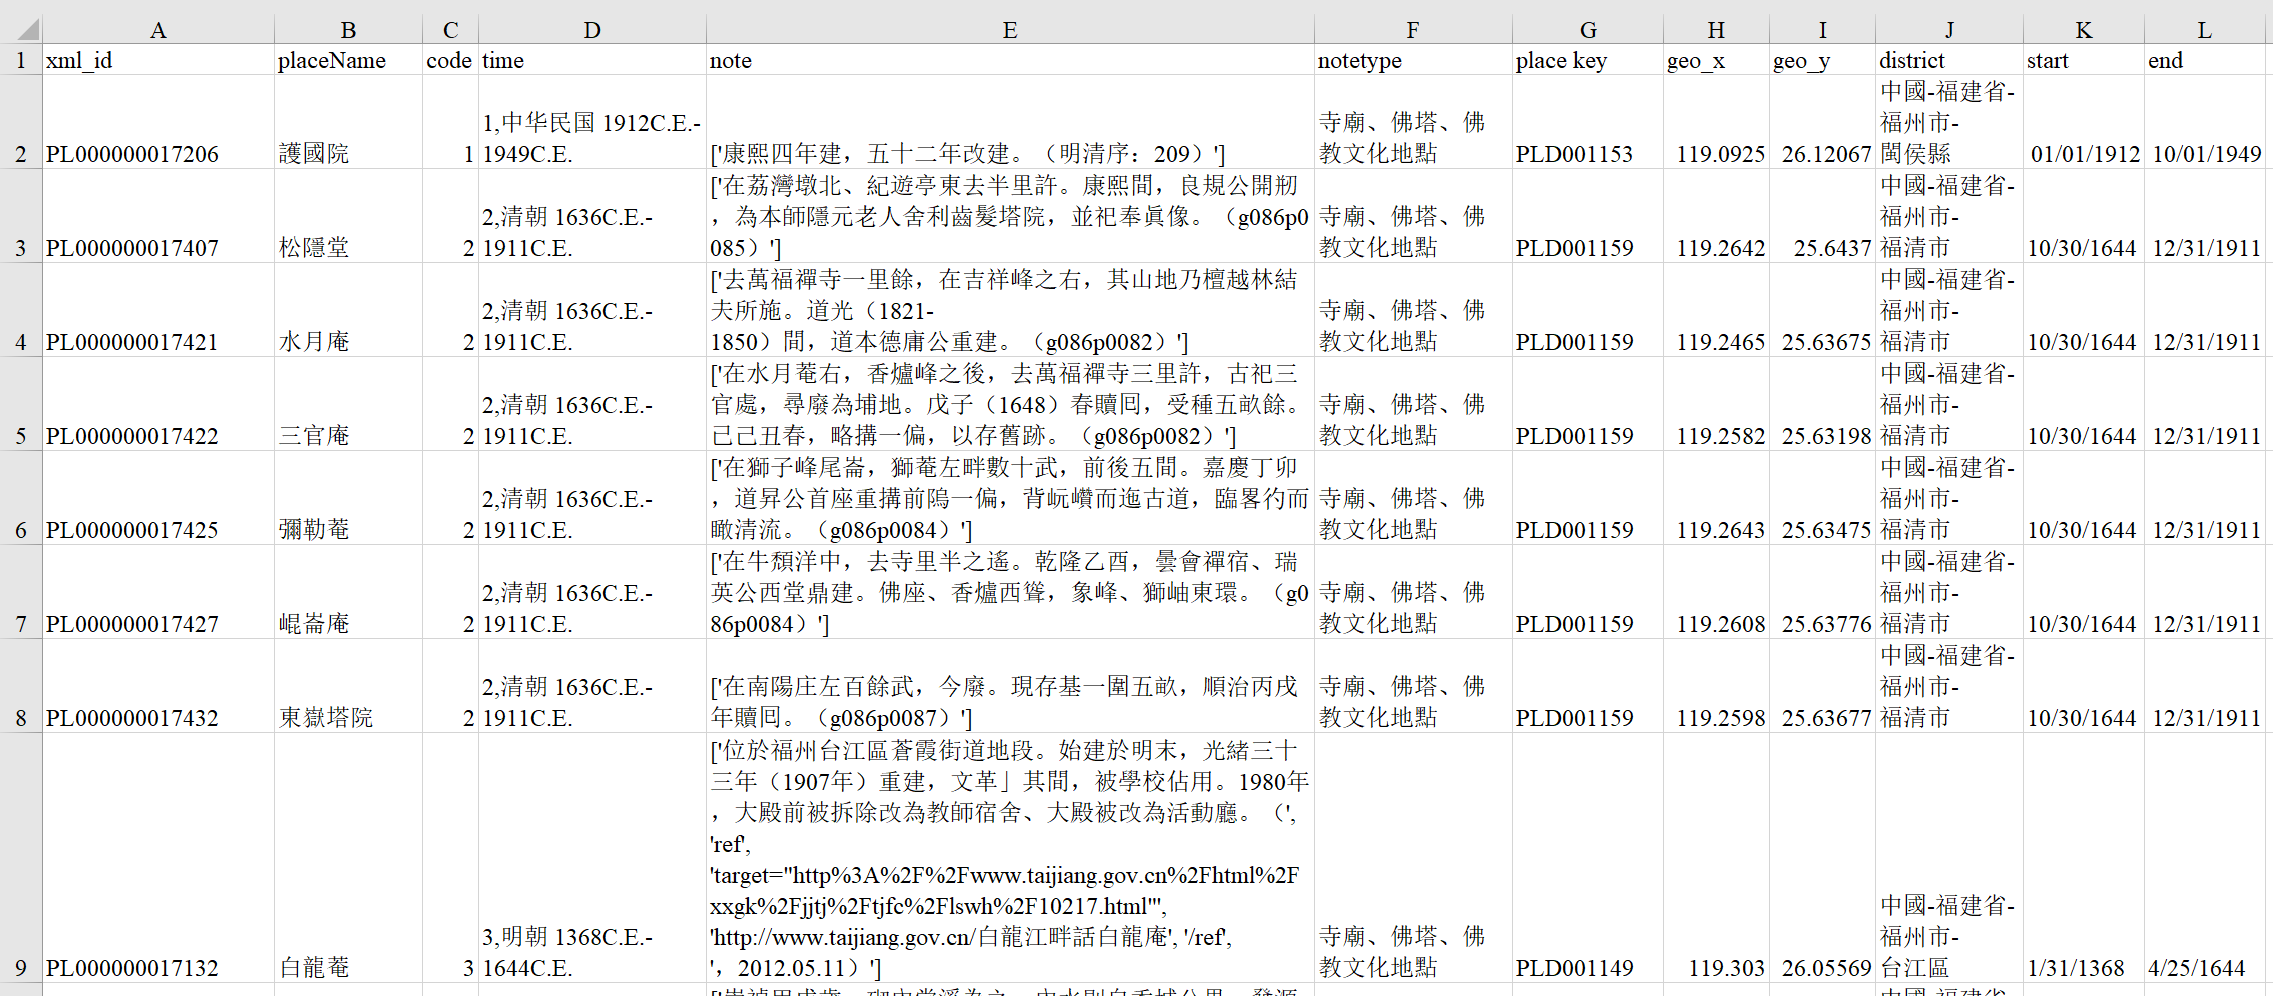
I checked the source of every entry closely to verify the information’s accuracy and added a column for the construction date if it appears in the text. I added a column for the dynasty information according to the corresponding construction date, as each layer will be grouped by dynasties. Here are a picture of books referred to and a picture of the CSV file I worked on.

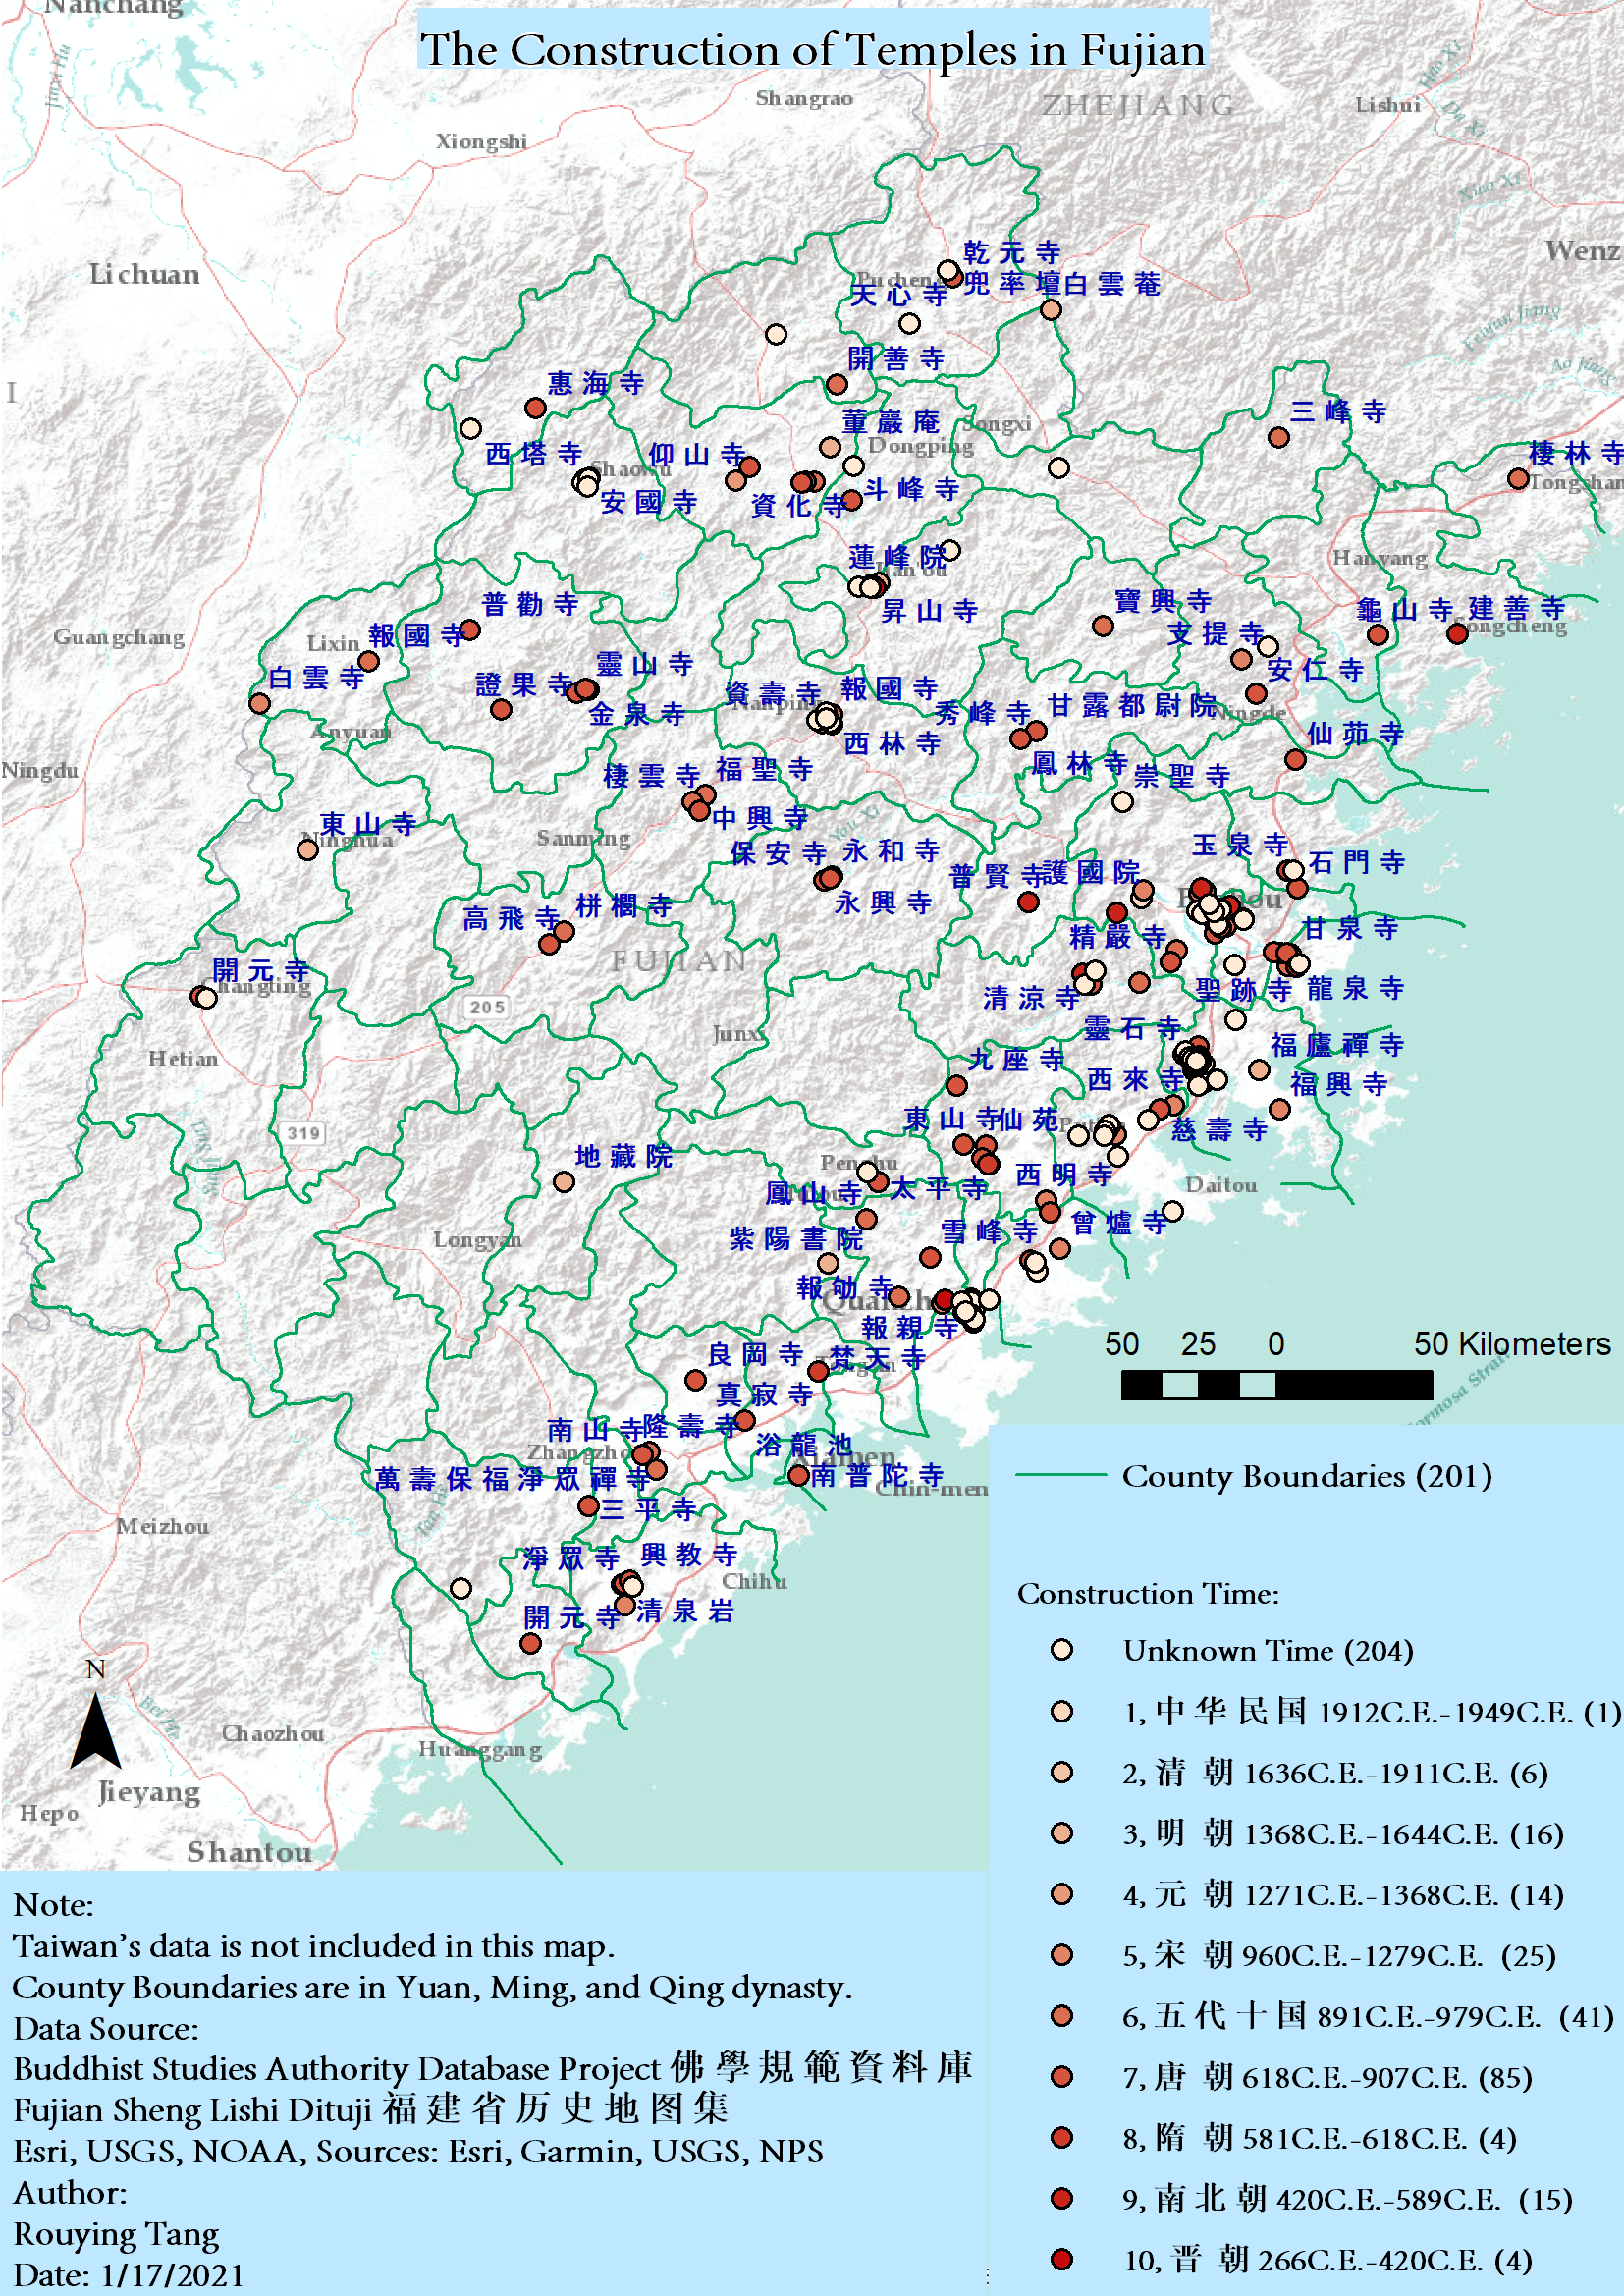
With the data I wrangled, I started the mapping. I imported the data into ArcGIS, adjusted the symbology, layout, and timeline set, then exported the maps I wanted. Here is one of the final maps.
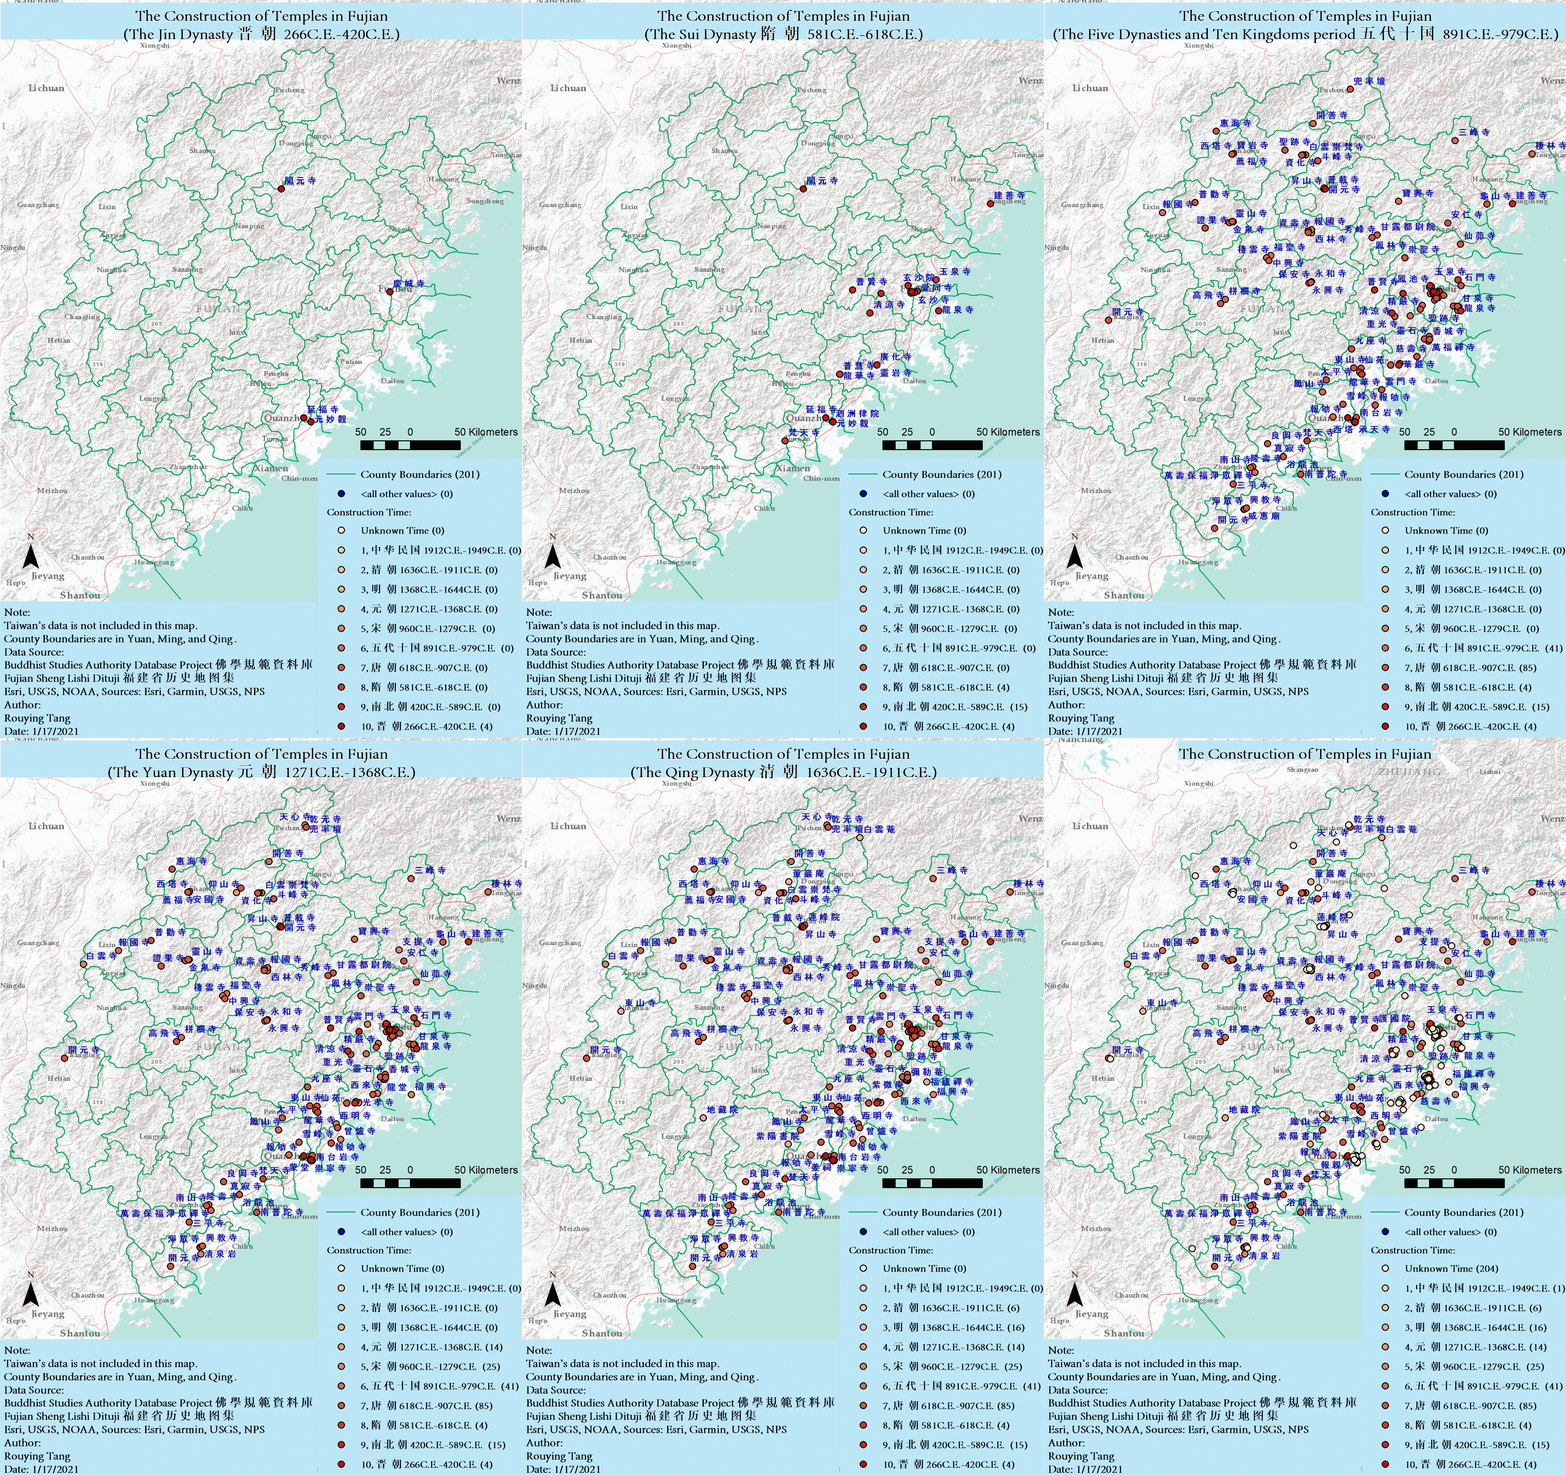
I used Adobe Premiere to animate the maps. Here is a GIF (it may take some time for the GIF to load if you are using a mobile device) and you may check my site http://www.letiangis.com for more information.
My original plan for the practicum work was to digitize the historical maps for Fujian. I knew most Chinese historical GIS projects, like “China Historical GIS,” mapped the counties as points, which is not convenient for further analysis like projecting location points in counties. Instead, I digitized the county boundaries in Fujian in the Yuan, Ming, and Qing with the start and end dates when the boundaries were recognized, referring to the existing paper sources like the Fujian lishi dituji 福建省歷史地圖集 and the Zhongguo lishi dituji 中國歷史地圖集.
Although I did not apply the data of county boundaries in the current project, I use the map as a background to show the location of the province of Fujian. The project of the county boundaries of Fujian costs me several weeks to finish. I learned that it is better to do a careful feasibility analysis before initiating a new project.
What is the conclusion, and what will be the next?
From the map and the video, I found that:
- The most temples were constructed during the period from the Tang 唐 (618-907 CE) to the Song 宋 (960-1279CE), followed by the late imperial period (1271-1911CE) and the Republic of China 中華民國 (1912-1949CE), and finally, the period from the Jin 晉 (266-420CE) to the Sui 隋 (581-618CE).
- The Fujian temples were constructed initially along the coast and then entered the middle hilly regions. This result agrees with the conjectures in Fujian fojiaoshi 福建佛教史.
- The temples are distributed along the present national and provincial highways, which may coincide with the historical highways. Many temples are built near transportation hubs. For example, Futian Temple (Futian si 福田寺) is near the Shan Pass (Shan guan 杉關).
In the future, I will explore the temple construction boom in the Tang dynasty (618-907 CE) and the chronological trend of temple constructions in relation to their geographic distributions. Why were they constructed from the coast and near the highway?
I will also explore the factors (hilly terrain and ocean) affecting the spatial and temporal pattern of the construction of temples in Fujian.
Currently, I am working on another project studying the elevation of temples in Fujian. I am curious about whether a relationship between the elevation and the construction of temples in this region exists, and whether this relationship supports the traditional impression that temples are more likely built in the mountains.
I am grateful for the help and advice from Dr. Marcus Bingenheimer, Dr. Alex Wermer-Colan, Dongshan Yang, Ivanessa Arostegui, and Sijia Wang for this project.
For more information about my GIS work, please visit my website at http://www.letiangis.com.
