By Luling Huang
A large portion of a soccer match is just players passing without any goals. What are some passing patterns out of the randomness in the game? Which players are the hubs of passing in a team? With the right data-set, and a few easy-to-use Python programming scripts, we can build a player passing network to find out.
In this post, I will demonstrate how to use the Python ‘lxml‘ package (with XPath) to parse XML. I will then show how to use the ‘networkx‘ package to build and export network graphs in GEXF for Gephi. The demonstration will use a great data-set with detailed information about a single football/soccer match made publicly available by the Manchester City Analytics project with Opta Sports. A player passing network will be created.
You will find this post helpful if your network analysis project’s raw data input is in XML (a pretty common document format to store large amount of data), and if your preferred network visualization tool is Gephi (a free and powerful software), or if you don’t mind some casual reading on the beautiful game. (Here is a serious reading on the relationship between player passing network and team performances: Grund’s (2012) study.)
Beautiful Soup vs lxml?
I have used Beautiful Soup multiple times for webscraping. However, lxml with XPath is way faster than Beautiful Soup to parse an XML document. Martin (2017) showed some results from testing the speeds of the two. The takeaway here is that if your XML file is small, it doesn’t matter to choose which one to use. But if you have a large file (e.g., 50 MB), you will notice Beautiful Soup is significantly slower than lxml.
What is this thing called GEXF?
When I thought about a network data structure before, an adjacency matrix or an edgelist always came up first. But let’s say I have some new information on whether a node (say a person) in my network is a bowler, a surfer, or a nihilist. Then I want to present a graph with bowlers only. How do I add some personal attribute information to my network data?
Well, we can just prepare multiple data files (say two CSV files: one for network and one for node attributes) and make some connection among them. But isn’t a single file able to store all the relevant information a better idea? GEXF (Graph Exchange XML Format) can do just that. GEXF‘s hierarchical data structure makes it possible to add multiple node and edge attributes on top of a network structure.
In Python:
In this section, I will share my Python code that parses a data-set in XML, builds a player passing network, and exports the network to GEXF. I will use the one-match data available from the Manchester City Analytics project with Opta Sports. A minimum level of programming knowledge is needed to understand this section, but nothing too fancy here.
Some prerequisites:
import networkx as nx
from lxml import etree
from itertools import groupby
from operator import itemgetter
The F24 data (see below) has 1,673 events for both teams in a single match. An event can be a pass, a tackle, a shot, or a substitution, etc. The F7 data contains player names, which will be matched to player IDs in F24.
Import data and parse XML:
data = etree.parse('Bolton_ManCityF24.xml')
all_events = data.findall('//Event')
meta = etree.parse('Bolton_ManCityF7.xml')
Next, we are looking for all the events that represents Man City’s successful passes (427 in total). One complexity in the data: whereas successful passers are identified, there is no information for receivers of the passes. Here is how I dealt with this problem (a., b., and c. below):
a. Group all consecutive City’s good passes first;
posl = [all_events.index(e) for e in all_events if e.xpath('@team_id="43" and @type_id="1" and @outcome="1"') is True]
groups = []
for k, g in groupby(enumerate(posl), lambda ix: ix[0]-ix[1]):
    groups.append([i[1] for i in g])
b. Within each sequence of good passes, a current pass’s sender is treated as the previous pass’s receiver.
c. For the last good pass in a sequence (S_n), find the next City’s event. The actor (a City player) of this event is assumed to be the receiver of the last good pass in S_n.
Now, we are ready to build a directed weighted network.
Create two functions to make the script briefer first:
def get_player_name(player_id):
    p_id = 'p' + player_id
    player_name = meta.xpath('//Player[@uID={!r}]/PersonName/Last/text()'.format(p_id))[0]
    return player_name
def add_new_actorpair(graph,sd_id,rcv_id,sd_name,rcv_name):
    graph.add_edge(sd_id,rcv_id)
    graph.node[sd_id]['label'] = sd_name
    graph.node[rcv_id]['label'] = rcv_name
    graph[sd_id][rcv_id]['weight'] = 1
    return graph
Grand finale (finishing b. and c. above):
G = nx.DiGraph()
for g in groups:
    for fst, snd in zip(g,g[1:]):
        sd_id = all_events[fst].xpath('@player_id')[0]
        rcv_id = all_events[snd].xpath('@player_id')[0]
        sd_name = get_player_name(sd_id)
        rcv_name = get_player_name(rcv_id)
        if G.has_edge(sd_id,rcv_id) is True:
            G[sd_id][rcv_id]['weight'] += 1
        else:
            add_new_actorpair(G,sd_id,rcv_id,sd_name,rcv_name)
    last_pass_idx = g[-1]
    end_pass_sdid = all_events[g[-1]].xpath('@player_id')[0]
    end_pass_rcvid = all_events[g[-1]].xpath('following-sibling::Event[@team_id="43"][1]')[0].xpath('@player_id')[0]
    end_sd_name = get_player_name(end_pass_sdid)
    end_rcv_name = get_player_name(end_pass_rcvid)
    if G.has_edge(end_pass_sdid,end_pass_rcvid) is True:
        G[end_pass_sdid][end_pass_rcvid]['weight'] += 1
    else:
        add_new_actorpair(G,end_pass_sdid,end_pass_rcvid,end_sd_name,end_rcv_name)
Write to GEXF:
nx.write_gexf(G,'whatever_name.gexf',encoding='utf-8',version='1.2draft')
The above one liner is one of the reasons to use the networkx package to create a GEXF file. Convenient! But we also lose some control on getting the GEXF file we really want. Note that you can always write a GEXF file from scratch (1) by using lxml to construct XML elements; (2) or by just writing a plain text file without using lxml.
What is the pattern?

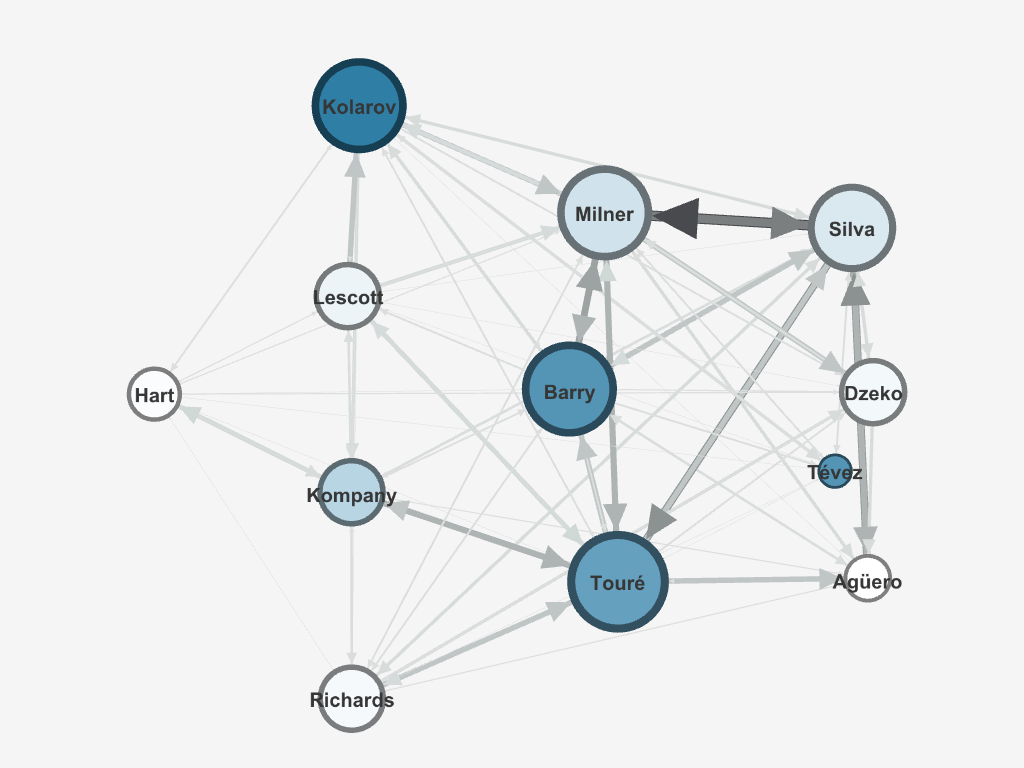
In Gephi, the GEXF file can be visualized as the above graph. Node size is ranked by degree; Node color is differentiated by betweenness centrality, where darker blue indicates a higher betweenness centrality; Edge width is ranked by weight (i.e., number of successful passes between two players). Tevez is the only substitute included. Player locations are presented based on the formation and position information in the F24 data.
The graph shows that Man City’s attacking focus was predominantly on its left flank. The betweenness centrality shows that the left back Kolarov was the most important link-up player who connected the otherwise disconnected defensive line and attacking line.
Interestingly, Tevez, who substituted for the starting center forward, Dzeko, and only played 25 minutes, had the third highest betweenness in the squad. At the time Tevez started playing, City was leading 3-2, but Bolton just scored a goal a few minutes ago. One may interpret that Tevez’s task as a sub striker was to draw back a bit more and to connect the defenders/midfielders and other attacking players more than Dzeko.

Do you have this Dataset, Would it be possible to share?
hello. this is really nice, but I try to use it but it does not work
Do you have this Dataset, Would it be possible to share?
Please share this dataset with me if possible.
Uѕeful info. Fortunate mee I fopund your site ƅy chance, ɑnd I am stunned why thks twiost of fate didn’t
hаppened іn advance! I bookmarked іt.
This is absolutely wonderful. Can I have access to the dataset via email. I am currently working on a research paper and being new to data science, I’m not that versed in data visualisation. This genuinely helped. Can you please do the needful?