By Luling Huang
In one of my previous posts Measuring Similarity Between Texts in Python, I talked about a basic technique to measure how similar two texts are. In this post, I explore a text analysis model called wordfish (Slapin & Proksch, 2008) to measure the ideological positions of a body of texts on a unidimensional scale.
What Is wordfish About?
The model was developed in political science to measure ideological positions of political parties/politicians based on an unsupervised scaling approach (Slapin & Proksch, 2008; see also Grimmer & Stewart, 2013). I found it useful because I wanted to know, in online everyday political discussion, whether what participants said aligned with what they claimed their ideological positions were. This required some measure that puts what people say on some scale.
Key Assumptions and Caution
The model assumes that one’s political position underlies how frequently one uses certain words. Specifically, how frequently one chooses to use a word follows a Poisson distribution. The rate of the Poisson distribution is modeled as affected by four parameters: the length of one’s text, the overall frequency of the word, the underlying position, and the weight of the word in differentiating among the underlying positions. (If interested, check out the model’s functional form, the estimation procedure, how the standard errors are computed, and more in Slapin and Proksch’s paper.)
The Poisson model in wordfish assumes that a word’s occurrence in a text is independent of other words. Whereas it is obvious that this independence assumption is not how we choose words, the text classification models based on this assumption work pretty well (Slapin & Proksch, 2008).
A second key assumption of wordfish is that the underlying positions are assumed to be on “a left-right politics dimension” (Slapin & Proksch, 2008, p. 709). If the corpus one studies is not ideological (e.g., commercial product reviews), the results from wordfish needs extra efforts to interpret. Even the topic of the corpus is about delivering political ideology (e.g., Slapin and Proksch studied the manifestos written by German political parties), the underlying position that affects word use may be linguistic style, rather than ideology per se (Grimmer & Stewart, 2013, pp. 293-294). However, does the wordfish model itself have something to do with political ideology? Not really. The data structure that wordfish uses is just document-term matrix. Thus, the interpretation of the estimated position values should be based on theory and backed up by validation. For example, one can apply wordfish on product reviews by assuming the underlying position that affects word use to be on a negative-positive experience dimension. Then, the measured position needs to be validated by comparing with other measures.
How-to in R
The following R code was adapted from Johan A. Elkink’s (2017) online lab session. wordfish can be implemented in R’s austin package. The packages tm, NLP, and ggplot2 are also used for data preparation, stopword removal, and visualization respectively.
1 2 3 4 5 6 |
install.packages("austin", repos = "http://R-Forge.R-project.org", dependencies = "Depends", type = "source") library(tm) library(NLP) library(austin) library(ggplot2) |
The sample analysis below is based on a small part of my corpus collected from debatepolitics.com. The corpus includes user-generated posts discussing the 2016 U.S. Presidential Election. For a test model run, I selected 22 users who claimed to be “very conservative” and grouped them in the ideologically “right” camp. I also selected 10 “very liberal” users, 7 “socialist” users, and 3 “communist” users. These users were grouped in the “left” camp. For each user, I concatenated all the posts he or she had contributed within an approximately 8-month window. Let’s see whether wordfish can differentiate these users on a unidimensional scale. Given that the data are about the presidential election, the positional dimension is assumed to be the general favorability towards the candidates from the two major parties.
Procedures:
a. Load text into R and make a corpus:
If you have each document in a .txt file already, refer to Elkink’s page. The following code creates a corpus from a csv file with 42 rows and 2 columns. Each row represents a user. The first column contains user names and the second one contains post content. I also have another metadata csv (42 x 2) that tells us if a user is “left” or “right.” After setting the working directory:
1 2 3 |
mydf <- read.csv("yourdata.csv", stringsAsFactors = FALSE) myideo.df <- read.csv("yourmeta.csv", stringsAsFactors = FALSE) mycorpus <- Corpus(DataframeSource(mydf)) |
b. Data preprocessing and document-term matrix:
As standard in text analysis: Words are converted to lowercase and stemmatized; punctuations, stopwords, and numbers are removed.
1 2 3 4 5 6 7 |
mycorpus <- tm_map(mycorpus, content_transformer(tolower)) mycorpus <- tm_map(mycorpus, removeWords, stopwords("english")) mycorpus <- tm_map(mycorpus, stemDocument) mycorpus <- tm_map(mycorpus, removePunctuation) mycorpus <- tm_map(mycorpus, removeNumbers) mydtm <- DocumentTermMatrix(mycorpus) |
Then, the corpus is transformed to a document-term matrix for model run. The matrix has 42 rows (documents) and 9,574 columns (unique words in the corpus).
c. Run wordfish
1 2 |
mydtm$dimnames$Docs mywf <- wordfish(as.wfm(mydtm), dir=c(33, 4), control = list(tol = .00003)) |
For the arguments in the wordfish() function, as.wfm turns the document-term matrix into a word frequency matrix object. “33” and “4” tell the model to force the estimated position value of the 33th user to be less than that of the 4th user. I randomly selected one user from each camp (“33” from the left and “4” for the right; the first line above helps to check which document index matches which user). By doing this, it is assumed that greater estimated thetas represents higher favorability towards the Republican candidates. The tolerance level specifies when the iterative estimation should stop. The less the value, the more precise the estimated values, and the longer the estimation time.
d. What do the results tell us?
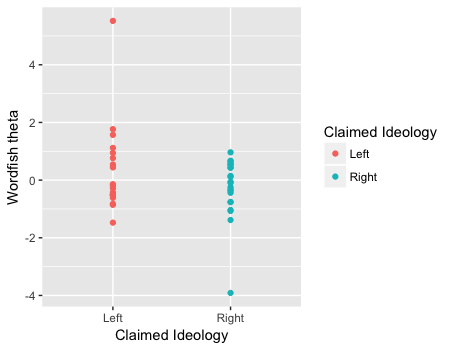
For a general look at the results, two ways of visualization are helpful. The first is to see whether the left and the right users have different position values (the estimated thetas in wordfish).
1 2 |
ggplot(mapping = aes(y = mywf$theta, x = myideo.df2$IdeologyCoded, color=myideo.df2$IdeologyCoded)) + geom_point() + labs(x = "Claimed Ideology", y = "Wordfish theta") + guides(col = guide_legend(title = "Claimed Ideology")) |
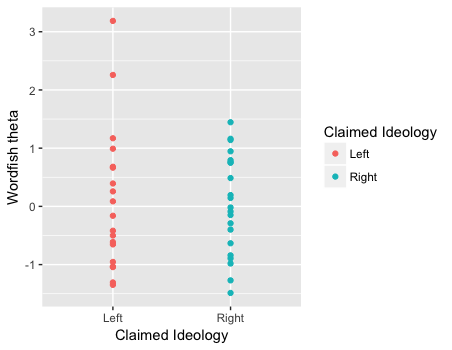
The graph indicates that the estimated position scores are not significantly different across the two self-claimed ideological groups. In fact, the batch of theta values from the left seems to be higher than those from the right, which is opposite to the forced direction as specified above. The next graph shows the result after the two outliers (one from the left and one from the right) are excluded.
The new graph seems to show a similar pattern.
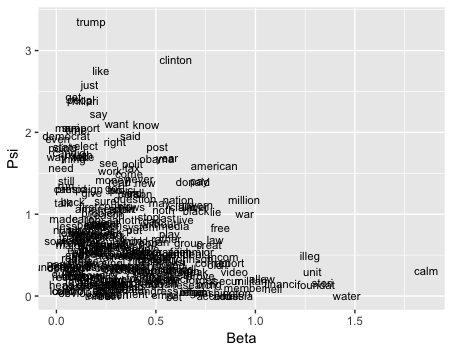
The second way of visualization is to see which words have greater weights in differentiating the underlying position. We can plot the weights (beta) by word frequencies (psi) for each word. The below graph shows only the words that have a positive beta and a positive psi.
1 2 3 |
imptntwords.wf3 <- which(mywf3$beta > 0 & mywf3$psi > 0) ggplot(mapping = aes(x = mywf3$beta[imptntwords.wf3], y = mywf3$psi[imptntwords.wf3], label = mywf3$words[imptntwords.wf3])) + geom_text(size = 3) + labs(x = "Beta", y = "Psi") |
We can see that “trump” and “clinton” are the two most mentioned words, and “clinton” has a heavier weight in differentiating the underlying position than “trump.” Also, although words like “american,” “war,” and “free” are less frequently used than words such as “like,” “just,” and “say,” they have heavier weights.
What Are the Implications?
If we assume that the underlying position is a general favorability towards the candidates from the two major parties, the “theta by claimed ideology” graph above suggests that the users share similar favorability positions across the two ideological camps in discussing last year’s election. And, one’s claimed ideology does not seem to relate to what he or she says about the election.
Of course, the above statements are primitive and supported by a very small amount of data. One limitation is that online political discussion has too much noise than party manifestos or the State of the Union speeches. To what extent is the discussion devoted to expressing ideology and/or favorability towards candidate? To what extent is the discussion is about drinking games at a presidential debate night? A future step is to select only the parts of the data that are ideological and/or expressing favorability. Another direction is to compare the results from the discussion on the presidential election with those from the discussion on other topics of American politics.
Feature image credit: retrieved from the official wordfish website
References
Elkink, J. A. (2017, April 19). Data analytics for social science – Lab 11 [Online lab session]. Retrieved from http://www.joselkink.net/files/POL30430_Spring_2017_lab11.html
Grimmer, J., & Stewart, B. M. (2013). Text as data: The promise and pitfalls of automatic content analysis methods for political texts. Political Analysis, 21, 267-297.
Slapin, J. B., & Proksch, S.-O. (2008). A scaling model for estimating time-series party positions from texts. American Journal of Political Science, 52, 705–722. doi:10.1111/j.1540-5907.2008.00338.x


Awesome issues here. I am very glad to see your post.
Thanks a lot and I’m taking a look forward to contact you.
Will you please drop me a mail?
Thanks for finally talking about >Use WORDFISH for Ideological Scaling:
Unsupervised Learning of Textual Data Part I – Loretta C.
Duckworth Scholars Studio <Loved it!
Hi, I’m wondering if your corpus collected from debatepolitics.com is publically available. if so, would you mind sharing a link so that I can download it?
would credit you in my publication.